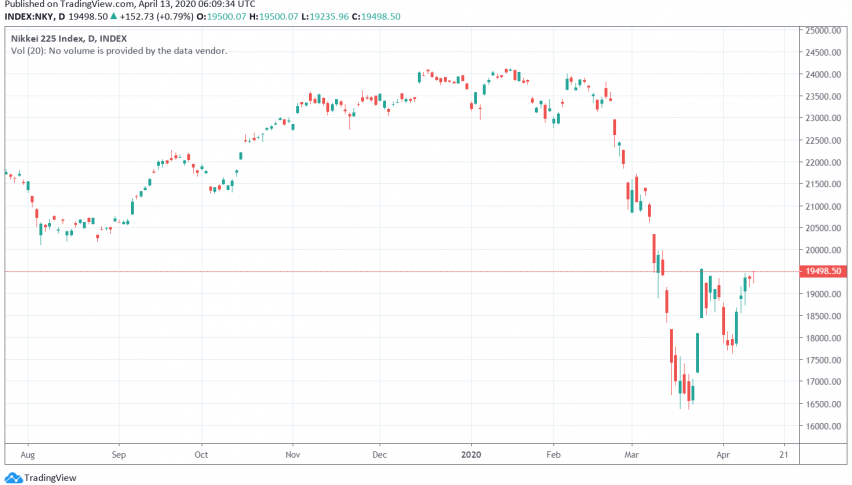
Nikkei Consolidates In The Range – Let’s Trade The Breakout
Today, trading is slightly slow as a result of the fact that there had been no major events during the Asian session. Things are likely to speed up in the next couple of hours, as investors are currently awaiting the New York trading session. Our Jan 17 – Morning Brief discusses the importance of US events and the Canadian Monetary Policy today, so buckle up and prepare for a ride of volatility…
Two Reasons To Short Nikkei – NKY
First of all, on the 30 – Min chart, the Japanese Index Nikkei has reached a support and resistance level of $23,870- this level has been tested by the index twice before, making it a double top pattern.
Secondly, the Doji candles below $23,870 represent the indecision among investors. Typically, the Doji candles followed by a bullish momentum signifies the shift in the investor sentiment.
Nikkei – 30 – Min Chart – Double Top Pattern
Overall, the Japanese index is currently stuck in a narrowly mixed trading range of $23,640 – $23950. Until there’s a breakout, we won’t be seeing any new trends.
Nikkei – Trading Idea
I will be waiting for the US industrial production and capacity utilization rate to help determine the direction of the market. The rough idea is to stay bullish only above $23,865, with a target of $23,938.The bearish positions are preferred below $23,750. Good luck.


