EUR/USD Might As Well Be Turning, Based on the Weekly and Monthly Charts


I was looking at the weekly chart of EUR/USD a few minutes ago and I spotted something interesting. This pair opened at 1.2420s last week and it closed at 1.2450s. The price moved about 100 pips above and below these levels, but closed where it did and it formed a morning star.
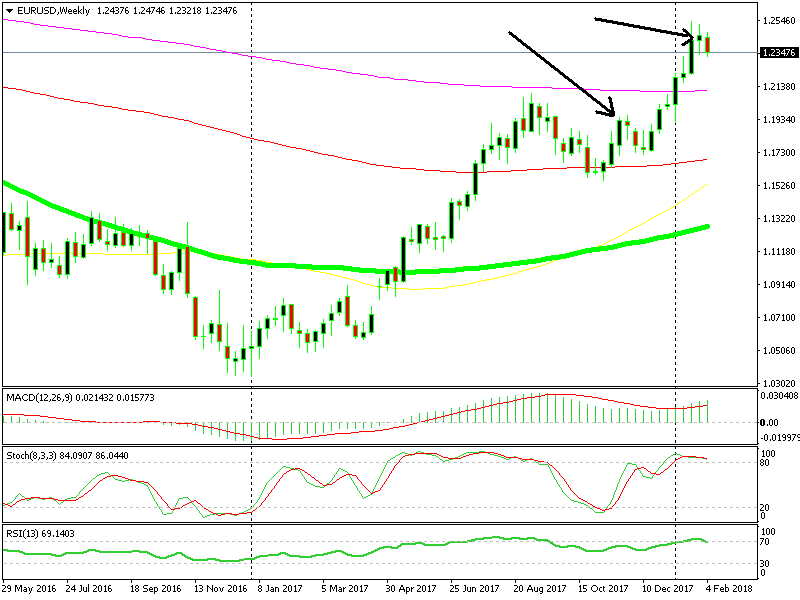
The morning star is pointing down
The morning star candlestick is a reversing signal after a move higher. If we don’t see a proper reversal, then a decent retrace should be coming. That’s what happened back in November, the weekly candlestick formed a doji and this pair retraced 200 pips lower. Dojis and morning stars indicate the same thing.
I then switched to the monthly chart. The monthly chart was pretty interesting as well. The price had reached the 100 SMA (green) which stands at 1.2550. This pair has climbed twice above 1.25 in the last two weeks, but it has reversed back below pretty quickly.
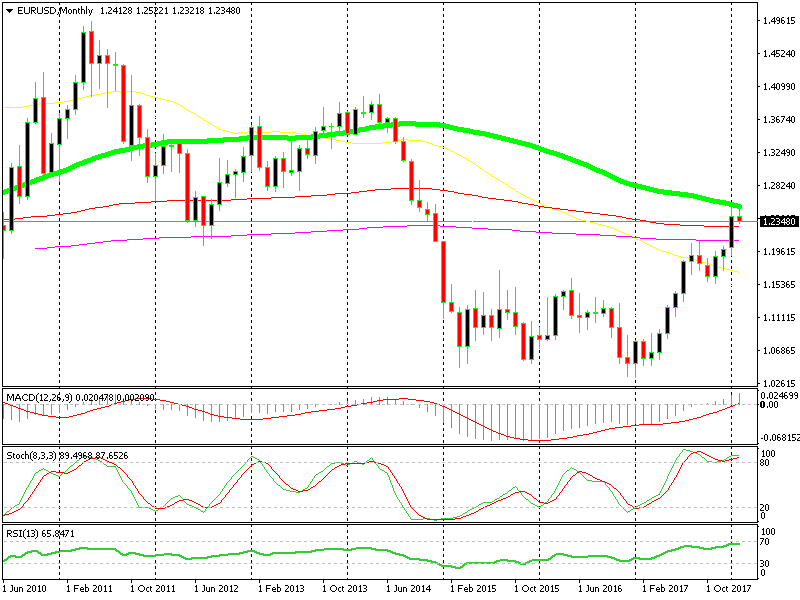
The 100 SMA is not letting go
So, it seems like this moving average is providing resistance on the monthly chart, that’s what the price action is telling us. The stochastic indicator and the RSI are severely oversold too, which makes he picture even more bearish.
We are already short on GBP/USD with a long term signal, so we might stay out of this. If we do and you decide to go short, I would suggest going short around 1.2450 with a stop above 1.26 and the first TP around 1.20.