GBP/USD Turns Down but Moving Averages Stand in the Way


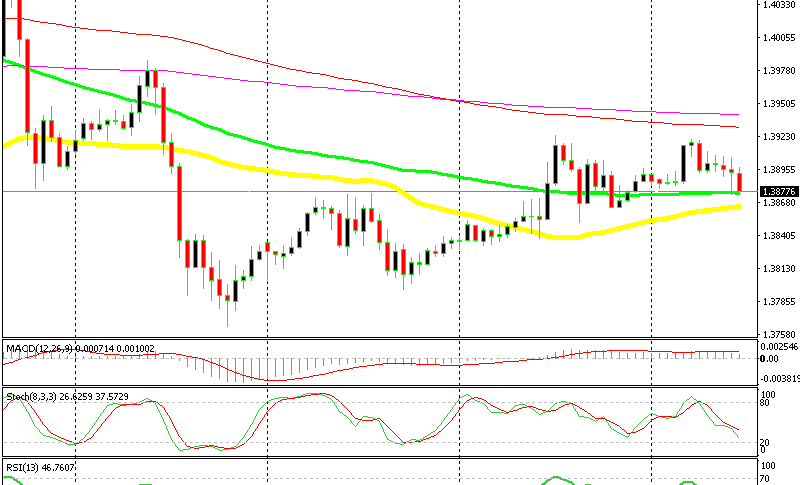
GBP/USD has been trading up in during this week after a strong downtrend in the first several days of this month. Although, we saw that the buyers were having trouble around the 1.39 level. They pushed up there a couple of times, but the sellers were pretty quick to jump in and reverse the price back down.
So, we decided to open a sell forex signal at 1.3887 in the afternoon. GBP/USD went down and then back up again, now it is turning down, so our signal here looks good at the moment.
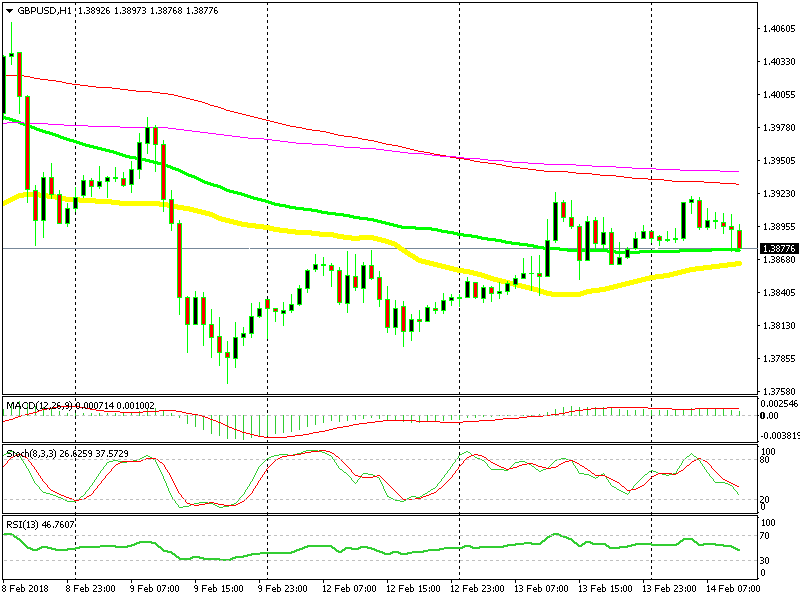
The 50 and 100 SMAs are standing below
But, moving averages are standing in the way today. As you can see from the hourly chart above, we are trading just above the 100 SMA (green) at the moment. This moving average has provided some mild support this morning and the price is having second thoughts around it. But, it might go at any time, since we are pretty close to it.
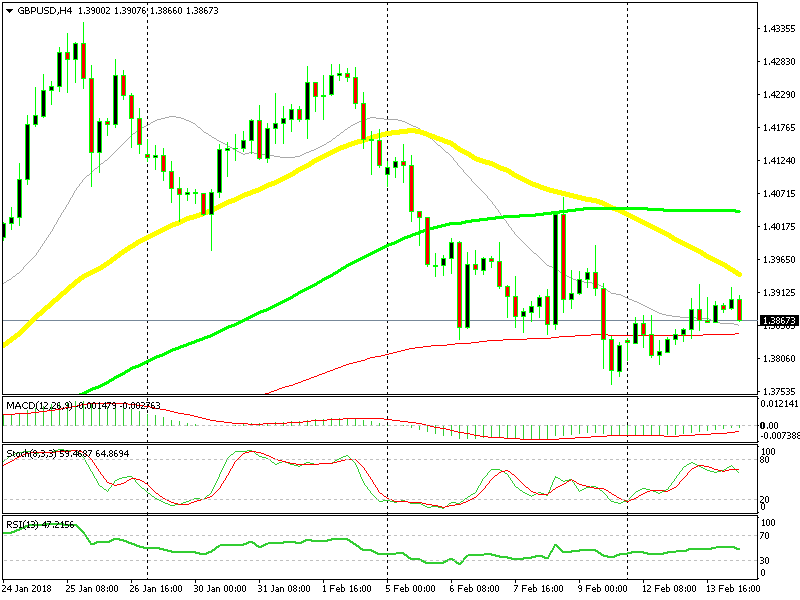
Around 10 pips lower, we find the 50 SMA (yellow). That is supposed to provide some support as well. If you switch to the H4 chart, you can see the 100 smooth moving average (red) at 1.3840. Although our signal would have hit the take profit target if we reach that moving average.
Stochastic looks bearish on this chart
The stochastic indicator is almost oversold on the H1 chart, so the move down is almost over on this timeframe. But, if we switch to the H4 chart again, we see that stochastic is almost overbought and heading down. There’s plenty of room to run to the downside and at the moment we are making a break lower. So, this forex trade look pretty god.