A Double Top Is Forming in EUR/USD, but the 100 SMA Is Keeping It Afloat
EUR/USD broke January’s highs last Friday. The high on January came at 1.2530s, which was the highest level this pair had reached in three years. That level was taken out last Friday as this forex pair climbed to 1.2550s.
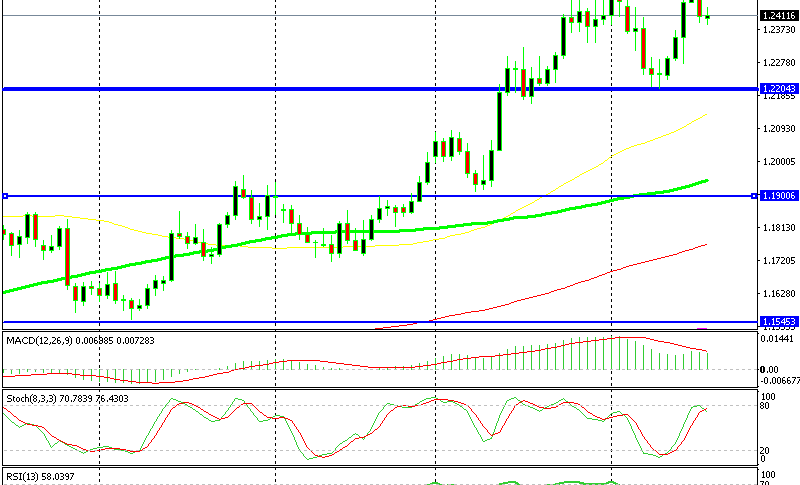
Although, looking at larger timeframes such as the weekly and the monthly charts, the resistance at 1.25 can’t be considered as broken. This resistance area around 1.25 is similar to the support area in USD/JPY which stretches from 105 to 105.50.
The Weekly Chart Setup

A double top is forming here
So, that resistance area hasn’t been broken and now EUR/USD looks like it is forming a double top. If a double top is forming, then we should expect to see 1.19 sometime in the near future.
The H4 Chart Setup

The 100 SMA is providing support
Although, there’s an obstacle on the way. Looking at the H4 chart, we can see the 100 SMA (green) that is providing support. It has been keeping the sellers at bay since Friday, so it is working well as support.
The sellers have to break below this moving average if the downside is to continue and the double top formation is to work out. But, the price is oversold as stochastic suggests and the previous candlestick formed a doji, which is a reversing signal.
So, unless this moving average is broken to the downside, this pair remains to trade on an uptrend. This looks like a good opportunity to open a long term sell signal, but I would like to see another push higher, so we can get a better entry price. That would minimize the exposure and increase the winning potential.


