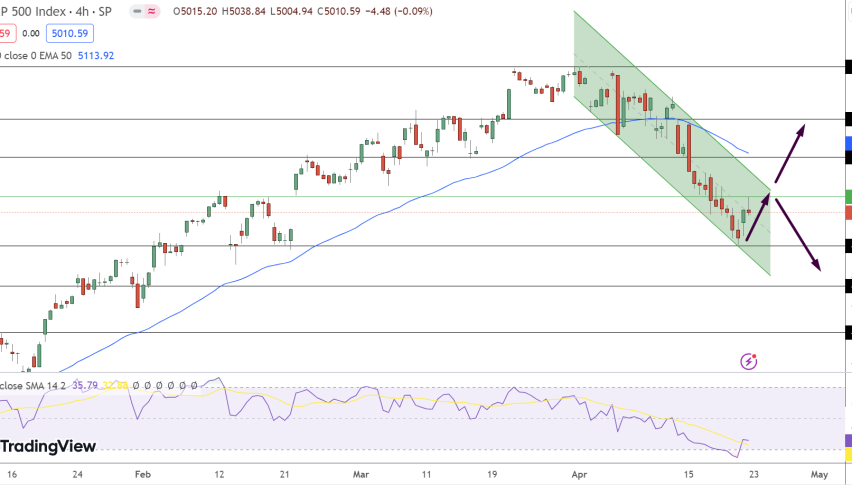
S&P 500 Ascending Triangle Breakout – Swing Trade Plan


Global stock markets rallied yesterday but on hold now as investors await the Fed chair Powell testimony for the first time. Moving the fundamentals aside, the US & German stock indices have formed a really powerful trade setup. Brace yourself for what’s called a swing trade.
S&P 500/SPX – Ascending Triangle Pattern Breakout
On the 4-hour chart, SPX was trading in the ascending triangle which supported the index above $2,705 along with a resistance at $2,745. The good news is, the index has broken out of this triangle, but regrettably, we missed a lot of action already as the SPX moved to $2,779 overnight.
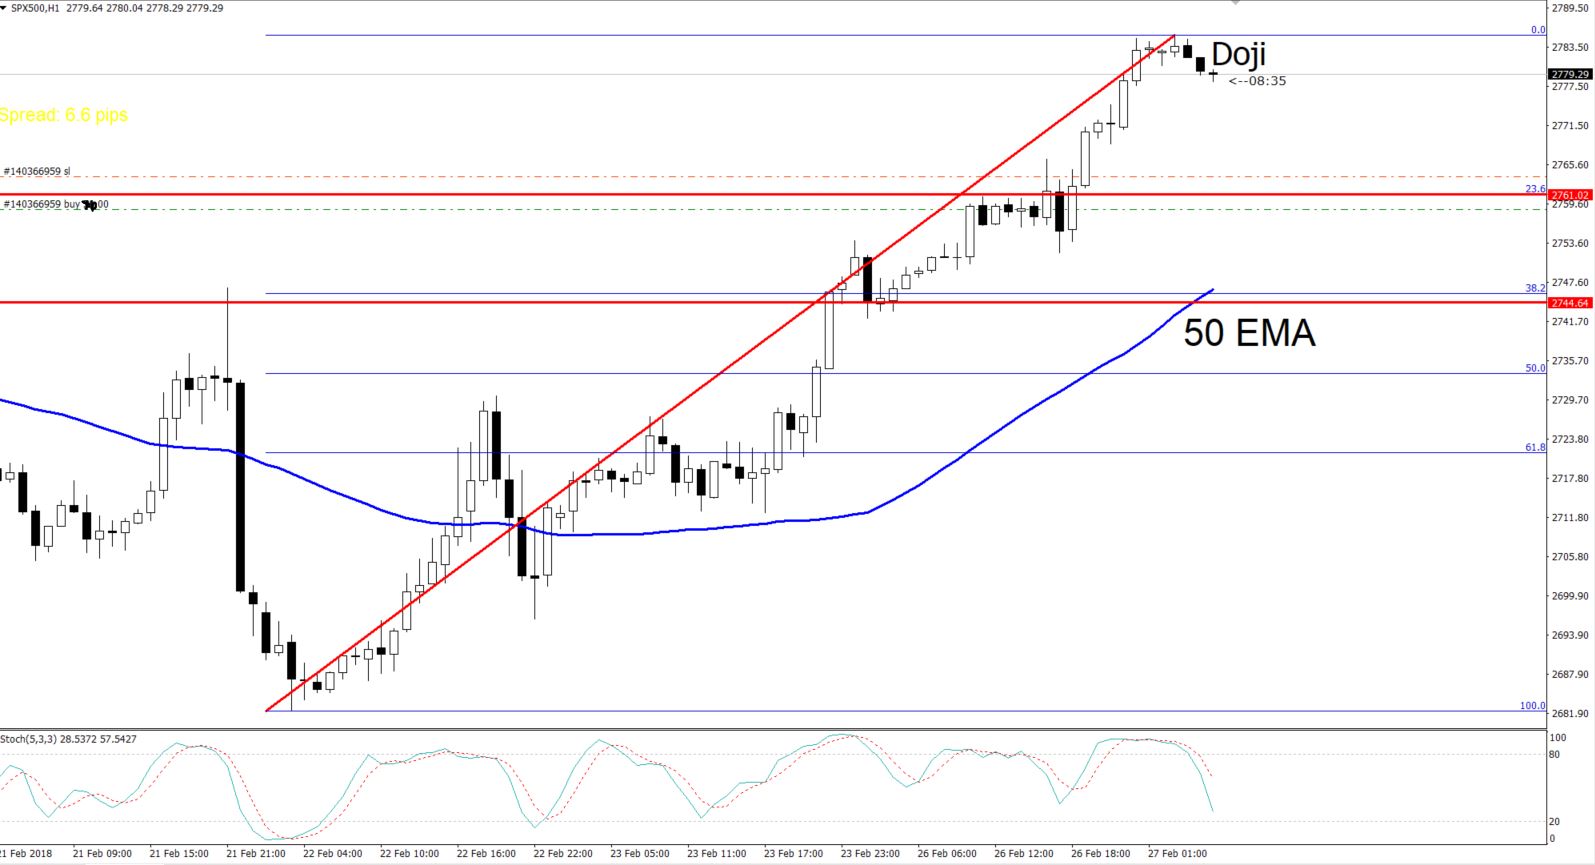
S&P500 / SPX – Hourly Chart
S&P 500 – SPX – Trading Levels
Support Resistance
2723.27 2749.27
2715.25 2757.29
2702.25 2770.29
Key Trading Level: 2736.27
What’s to Follow
I’m looking to buy an index as soon as the SPX completes 23.6% or 38.2% retracement at $2,760 and $2,745, respectively. The evening star candlestick pattern signifies the chances of retracement in the index. Check out FX Leaders Candlestick Trading Strategy for more detailed information on candles.