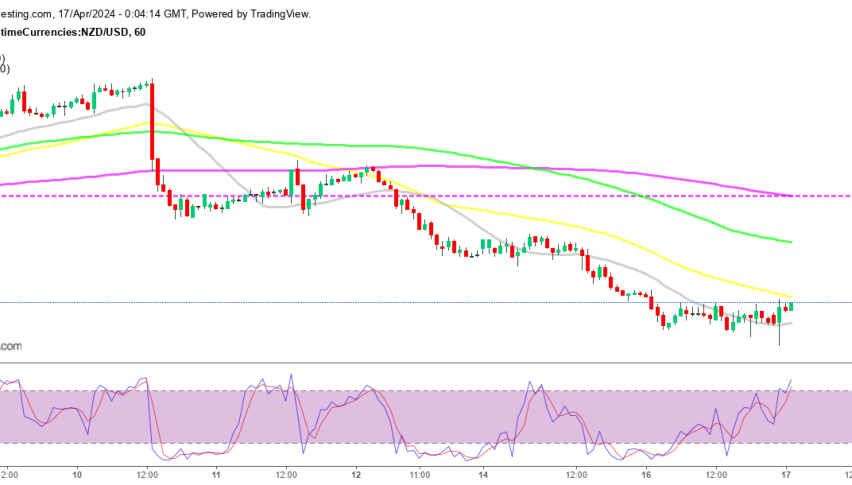
A while ago we went short on NZD/USD. This forex pair had been retracing higher for several hours this morning but the hourly chart looked like it was setting up for a bearish reversal, so we decided to take this trade right then.
So what did the H1 chart look like?
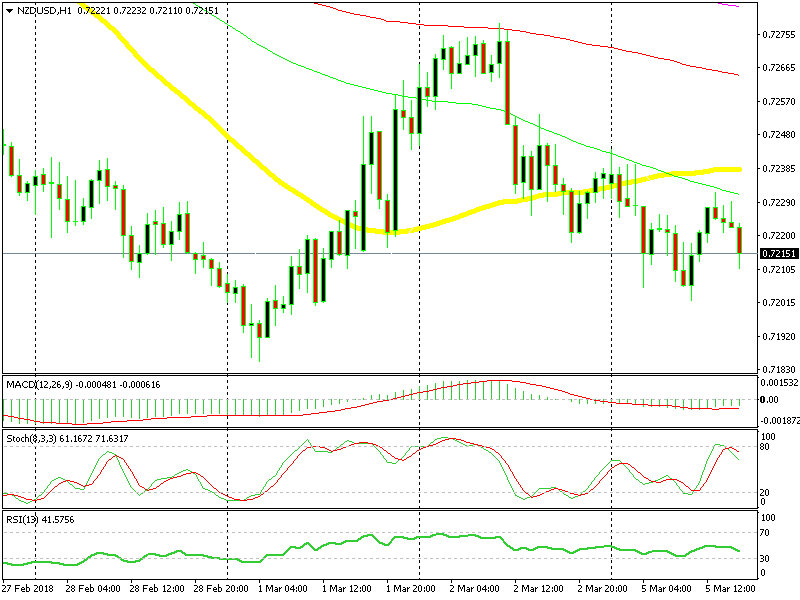
The 100 SMA did a good job providing resistance today
It looked like this. The price was having difficulty breaking above the 100 SMA (green). The buyers pushed up there a few times but the sellers managed to push back lower. So, the price action seemed like NZD/USD was about to turn back down.
The stochastic indicator was also overbought, which meant that the retrace up was complete. If we switch to the H4 chart, we can see that the 20 SMA (grey) was also providing resistance on the top side this morning.
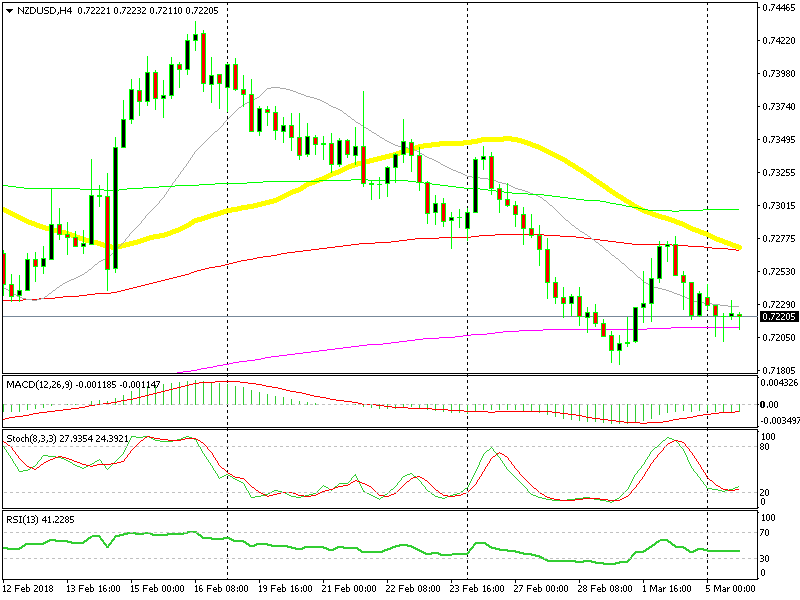
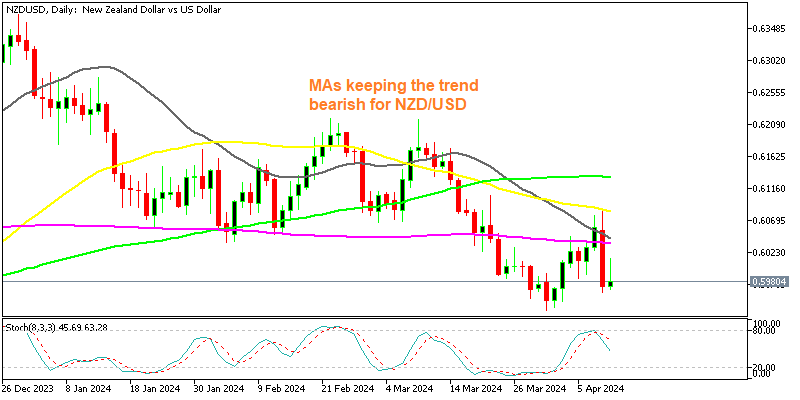
The 200 SMA is an obstacle for sellers
Besides that, the trend of the last two weeks has been pretty bearish. The price turned around sharply more than two weeks ago and since then this pair has lost more than 200 pips. The 20 SMA turned down as well and it has pushed the price down since then.
This morning the 20 SMA pushed NZD/USD lower again. But the 200 SMA (purple) is standing in the way at the moment. This moving average has been providing support all day today, so the price is stuck between these two moving averages on the H4 chart. Let’s see which one goes first. We sure hope that the 200 SMA lets go.