Gold Hammer Pattern – Buyers Hover at Support Level


Gold is consolidating in a narrowly mixed trading range as investors await the US labour market figures coming tomorrow. The US is not expected to release any high impact economic event today so it’s best to trade the technicals. Who’s ready?
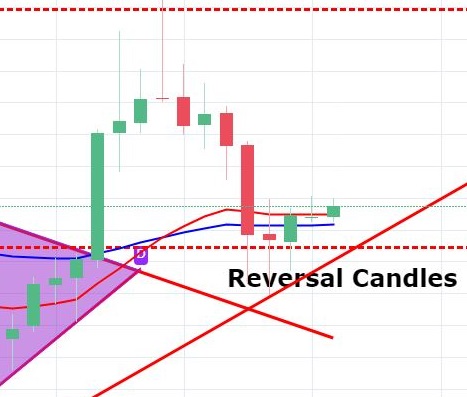
Technical Outlook – Bullish Reversal Candles
On the 4-Hour chart, Gold formed a hammer candlestick pattern. This particular pattern is followed by a strong bearish trend and typically weakens the bearish momentum. It won’t be wrong to expect a bullish reversal in Gold after the hammer pattern. Check FX Leaders Candlestick Strategy for further information.
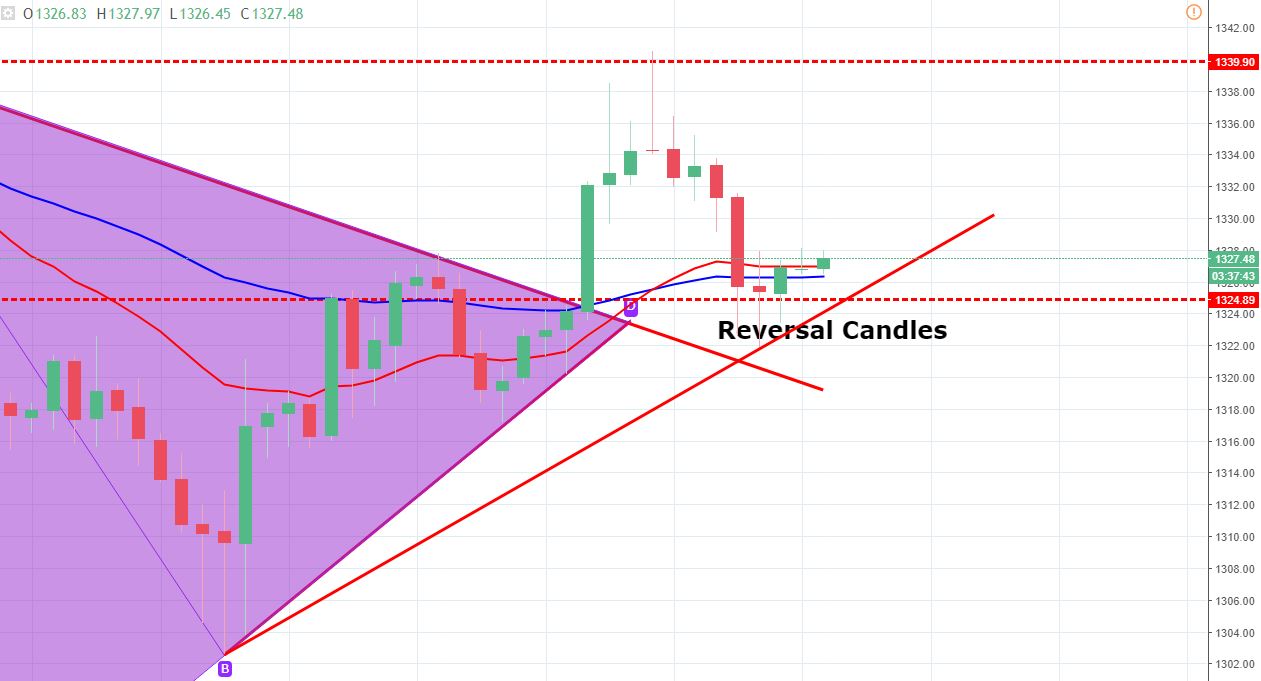
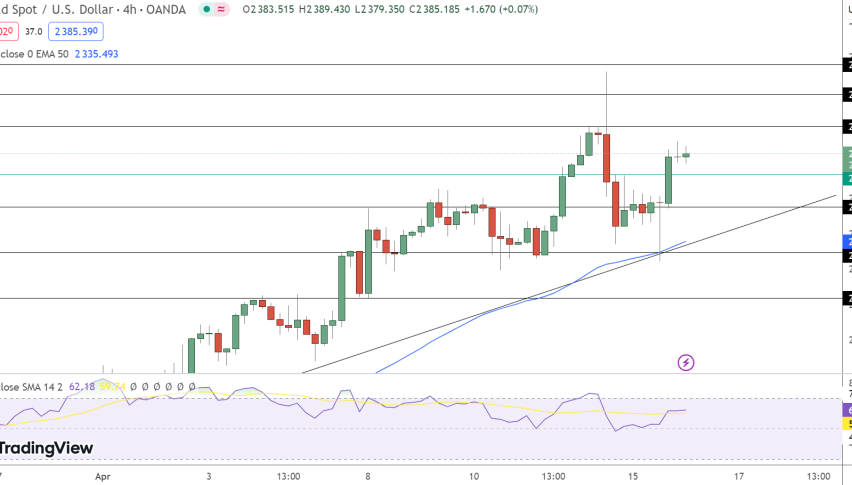
Gold – 4 – Hour Chart
Secondly, the 50 periods EMA is supporting the metal at $1,324 and the 4-hour candle above it is confirming the bullish bias of investors.
Support Resistance
1322.96 1337.18
1318.58 1341.56
1311.47 1348.67
Key Trading Level: 1330.07
Gold – XAU/USD – Trading Idea
We may experience a choppy session today in Gold so stay bullish above $1,324 with a target of $1,329. On the upside, $1,330 looks like a strong selling point.
Good luck!