The US Dollar has been beaten up pretty bad in the last week or so as it has lost considerable ground against most major currencies during this time. Trump’s tariffs and peace talks from North Korea have damaged the USD.
Cryptocurrencies formed a bearish chart setup on Monday and in the next 2-3 days, the bearish setup unfolded in full force.

Cryptocurrencies formed a bearish chart setup on Monday and in the next 2-3 days, the bearish setup unfolded in full force. Today though, they are trying to recuperate. EUR/USD is forming a bearish setup as well, exactly like the one we saw in Bitcoin on Monday, which is pointing to the downside in this pair. Let’s see how this chart looks like.
EUR/UD is trying to make up its mind at the moment
EUR/USD Is Turning Bearish
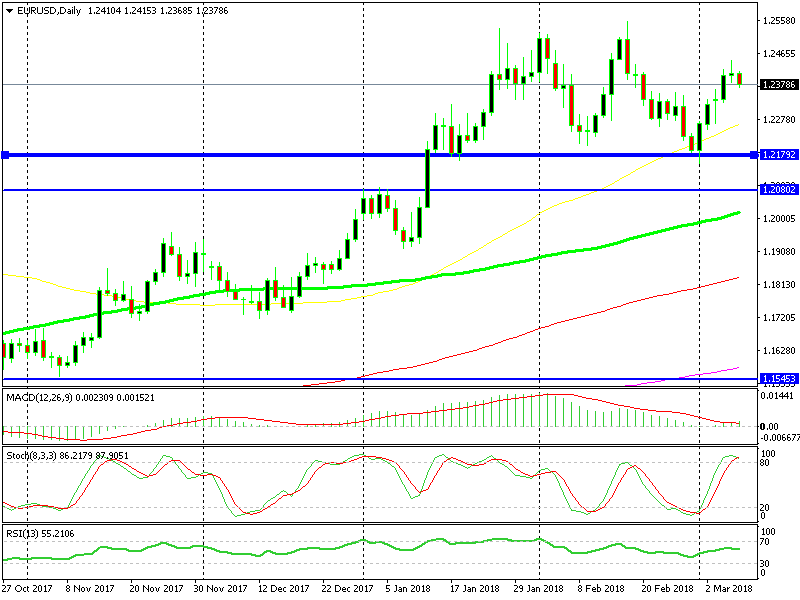
EUR/USD has been trending higher in the last several days. At first, it was Donald Trump which sent the Buck lower, thus reversing this pair higher when he tweeted about tariffs on Steel and Aluminium. He will sign the … today. This means that Trump is opening another front in this trade war and that is not good for the USD in the short term.
The next push higher came after North Korea turned soft which improved the market sentiment. As a result, EUR/USD climbed around 300 pips in the last several days. But, it failed to reach the previous highs above 1.25. This is a bearish sign.
The stochastic indicator is already overbought and it is now turning down. This means that EUR/USD is overbought on the daily timeframe, so the next move should be down.
Another bearish signal is yesterday’s daily candlestick. It formed a doji and the doji is a reversing signal. Today’s candlestick has already started to look bearish, but the market is awaiting the ECB, so the price action has been pretty slow today. The ECB is expected to remain cautious again today, which should be sort of dovish for this pair.
EUR/USD is looking bearish but the ECB is ruining the chart setup
Bitcoin Is Trying to Reclaim the $10,000 Level
Bitcoin formed a pin candlestick on Monday just below the resistance level at $11,600-700. Just like EUR/USD at the moment, Bitcoin looked like it was turning bearish, which unfolded in the next few days.
Yesterday, the downside picked up more pace as Bitcoin broke the $10,000 level. It briefly climbed above that big level again, but eventually closed the day below $10,000.
Today though, the sellers look weak. They don’t seem to be able to push further below and make some new lows. That would be bearish. But if the sellers can’t make new lows, then the pressure shifts to the upside.
The low of this latest bearish move comes at $10,200-300. That was the low about two weeks ago during the previous bearish move. So, this area has formed a strong support level and Bitcoin has traded inside it for nearly a month.
Today, the buyers are trying to reclaim the $10,000 level again. They pushed above it a few hours ago but again, the sellers pushed it back down. Well, the reverse up doesn’t come that easily, so it will take some time. But, the range is clear here and Bitcoin is having difficulties breaking the bottom line of this range. That means that the next move will be up.
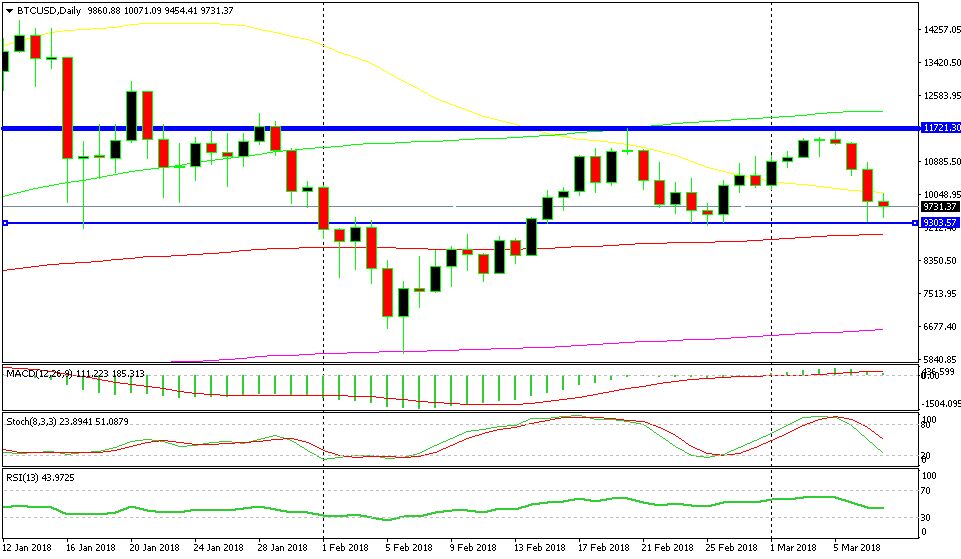
The range is $1,500 wide in Bitcoin
Trades in Sight
Bearish GBP/USD
- The 100 SMA is providing resistance on the H4 chart
- Stochastic is overbought and turning down
- The 20 SMA is providing resistance on the daily chart
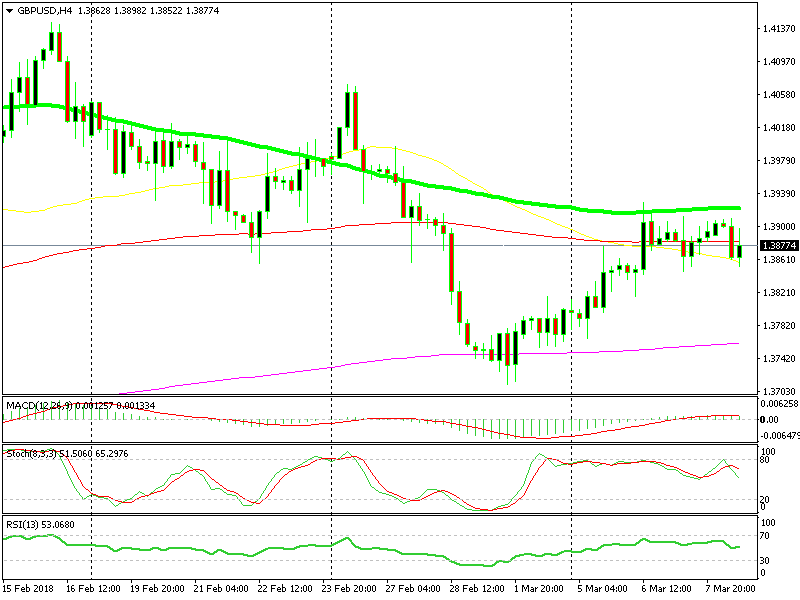
The 100 SMA has done a gat job this week
We had a sell forex signal in this pair which closed earlier today. We opened at 1.3880s yesterday and we plan to open another one around those levels. The 100 SMA (green) has been providing resistance on the H4 chart at 1.3910 and the 20 SMA has been providing resistance on the daily chart at the same levels. This pair is climbing higher now, so get ready.
In Conclusion
The ECB left the interest rates on hold an hour ago, as expected. But the statement had a more hawkish tone, so the Euro is rallying. Mario Draghi is holding the usual speech, so there’s volatility in the major pairs right now.
- Check out our free forex signals
- Follow the top economic events on FX Leaders economic calendar
- Trade better, discover more Forex Trading Strategies
- Open a FREE Trading Account
- Read our latest reviews on: Avatrade, Exness, HFM and XM
Related Articles


Sidebar rates
Related Posts
