Long in NZD/USD at the Same Technical Indicator
On Monday we opened a forex signal in NZD/USD. We bought this pair at the 50 SMA (yellow) on the hourly chart and it closed in profit yesterday during the latest upward move on this pair, which came as a result of some renewed USD weakness.
Today though, we see that this forex pair has completed another retrace down on the H1 chart. NZD/USD has pulled back lower this morning and it has now reached the 50 SMA again. This moving average has been a helpful indicator recently for this pair, so we thought of using it again for another trade.
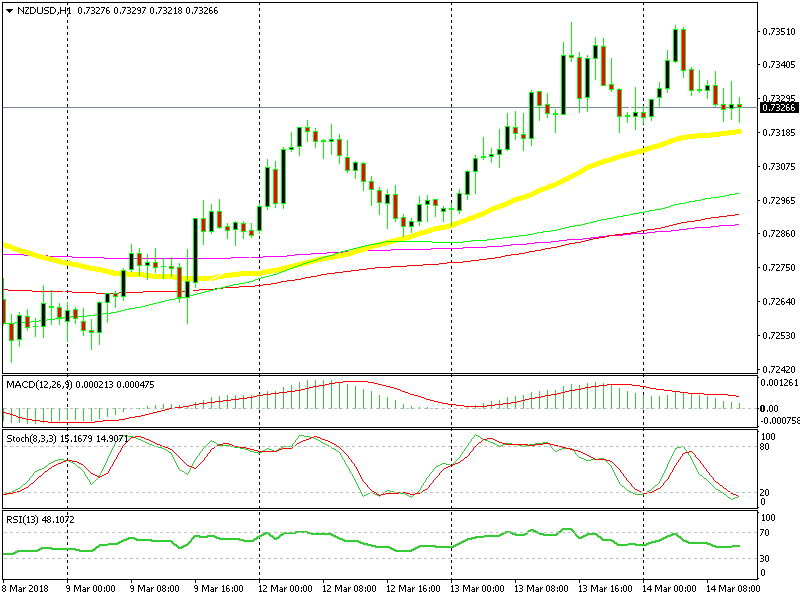
The 50 SMA is providing another trading opportunity for us
We say the retrace is complete because the stochastic indicator is oversold on this timeframe chart. As we know, the stochastic is a good indicator to signal overbought and oversold levels. Now it is oversold, so ths pair is oversold.
Besides that, the last few candlesticks closed as dojis. Dojis are reversing signals after a retrace is complete, so we went long based on this chart setup. The Aussie has been more upbeat this morning, but AUD/USD is in the middle of a move higher and we like to pick retraces, so we picked NZD/USD. The retrace down in this pair is complete, now the uptrend is resuming.


Sidebar rates
Related Posts
