Trading the Downtrend in USD/CAD After the Retrace
A while ago we opened a sell forex signal in USD/CAD. This forex pair has been trending down since the start of last week.
A while ago we opened a sell forex signal in USD/CAD. This forex pair has been trending down since the start of last week. The trend was very steep in the first few days, but the it slowed down by the end of last week. Although, the downtrend is still valid.
On the hourly chart below, you can see that this forex pair has made a few retraces starting from Thursday last week. They have been just retraces because the downtrend has continued after the retraces were complete.
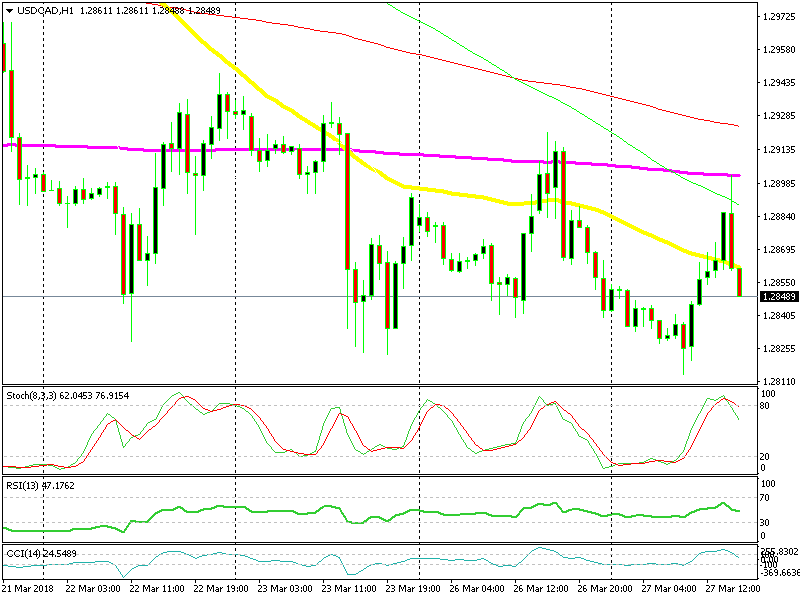
The 50 SMA got broken but the 200 SMA did a good job
About two hours ago, USD/CAD was making another retrace higher which started this morning. When we opened our sell signal here, the buyers were having trouble at the 50 SMA (yellow). The stochastic indicator was overbought, which means that the retrace up was complete.
Besides that, the price formed two doji/pin candlesticks just below the 50 SMA. Dojis and pins are reversing signals, especially when stochastic is overbought and a moving average is providing resistance.
But, the US Dollar received some unexpected bids which sent this pair higher above the 50 SMA. That looked dangerous for our sell signal in USD/CAD, but the 200 SMA (purple) did its job correctly. The price reversed lower after kissing that moving average and now the picture looks much better. The stochastic is headed down so the downtrend is resuming, we’re holding on to our forex trade.
- Check out our free forex signals
- Follow the top economic events on FX Leaders economic calendar
- Trade better, discover more Forex Trading Strategies
- Open a FREE Trading Account
- Read our latest reviews on: Avatrade, Exness, HFM and XM
Related Articles


Sidebar rates
Related Posts
