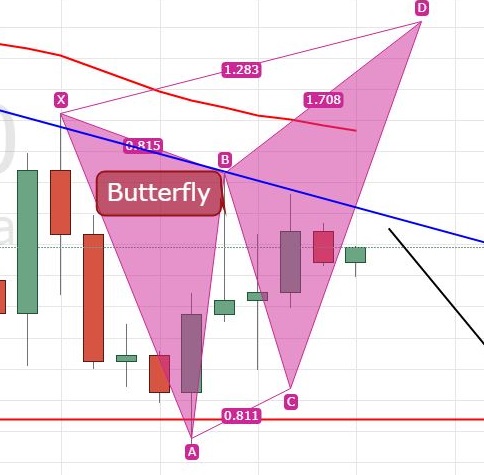
Bullish Butterly In USD/CAD – A Quick Technical Setups Before GDP!
It looks like investors are buying the buck to take full advantage of positive GDP figures thereby supporting the dollar ahead of the US gross domestic product release today. Let me share some hot setups to trade US GDP today…
USD/CAD – Potential Bullish Butterfly
The US Bureau of Economic Analysis will release the Final GDP q/q later today. Therefore, the USD/CAD can offer us some nice trade opportunities.
On the 4-hour chart, I spotted a potential bullish butterfly setup. USD/CAD completed a 61.8% retracement near 1.2900 and later fell to 1.2840 trading zone to complete B to C wave.
USD/CAD – 4 – Hour Chart
Technically, the pair is likely to go for the C to D wave which completes somewhere around 1.2960. But for now, the pair is overbought and should come down to complete the retracement.
On the downside, the pair is likely to face a solid support at 1.2823 and a break below can lead prices towards 1.2756.
USD/CAD – Key Trading Levels
Support Resistance
1.2832 1.290
1.2812 1.292
1.2778 1.2954
Key Trading Level: 1.2866
USD/CAD – Trading Plan
Investors are advised to keep a close eye on 1.2865. Above this level, the pair is likely to continue trading bullish until 1.2925. Good luck!


