The 100 SMA, Once Support, Now Resistance
If you have noticed, we use moving averages quite often when trading forex. They are great indicators in providing support and resistance so we are using them for this trade as well. After all, there are only a handful of technical indicators that work this well.
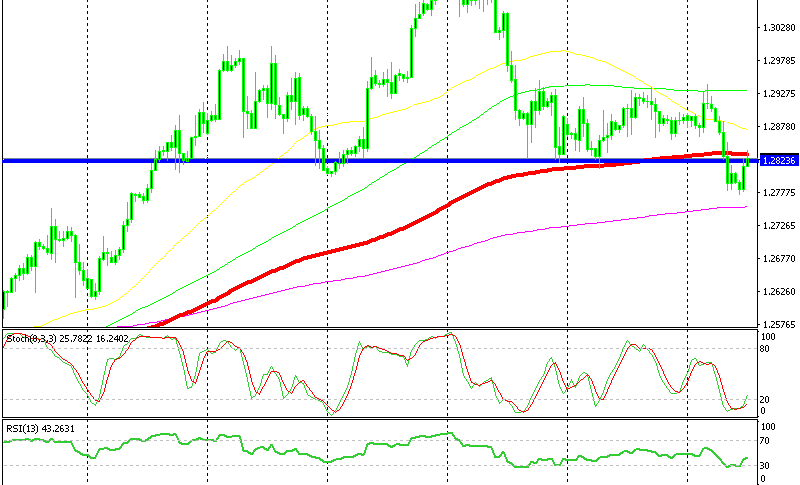
As you can see, USD/CAD has been on an uptrend for quite some time until it started reversing two weeks ago. This forex pair reversed at 1.3120s two weeks ago but the decline stopped last week as USD/CAD traded in a 100 pip range, more or less.
During this time, the 100 SMA (red) has been providing support on the H4 chart. Although, this week the 100 SMA has been broken to the downside, so it looks like the next leg of the downtrend is underway.

The 100 SMA has been support, now it has turned into resistance
Today, the buyers have been trying to become active. They have pushed this forex pair higher from the lows, but this looks more like a retrace. We can say that the trend changed two weeks ago and today’s price action looks more like a retrace higher.
We just opened a sell forex signal here since the stochastic indicator is overbought on the H1 chart. The H4 chart is not overbought but it’s the moving average which has signalled us to take this trade. The 100 SMA is providing resistance on top so the retrace might be over, even though stochastic is not overbought.
As you can see, the area around 1.2920 has been providing support in the last two weeks, while it has turned into resistance now. This strengthens the resistance, so we decided to take the trade. Judging by the price action of the last few days, I am pretty confident in this trade.


