After EUR/GBP, Now It’s the Time to Short GBP/USD
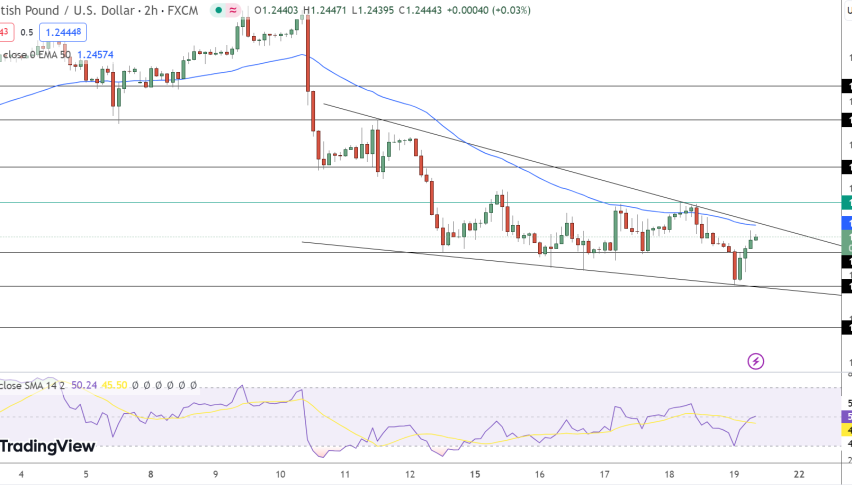
A while ago we bought EUR/GBP as it was sliding lower towards the 200 SMA on the H4 chart. We decided to open a signal on GBP/USD and the first signal looks good now, as that pair is beginning to reverse. It touched the 200 SMA and began the reverse as we predicted. The H4 candlestick is closing as a pin, which is a reversing signal. Now, the chart setup looks to be turning bullish.
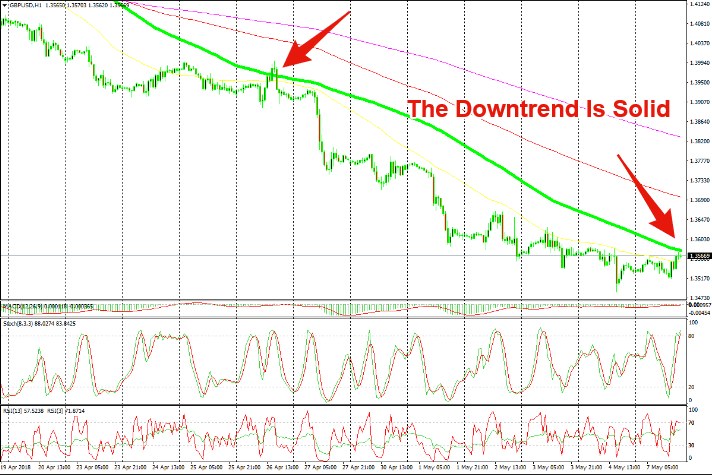
This means that GBP/USD should be starting to turn bearish. It is on a small bullish run actually, but I think that now is the time when it starts to turn bearish. As you can see from the hourly chart below, GBP/USD has retraced around 80 pips higher since Friday afternoon after the US employment report was released.
Now, the hourly chart is overbought since the stochastic indicator has reached overbought levels. The buyers are facing strong resistance at the 100 SMA (green) as well. The price touched that moving average and has somewhat retreated now. The previous hourly candlestick closed as a doji which is another bearish reversing signal.

The H4 chart is almost overbought
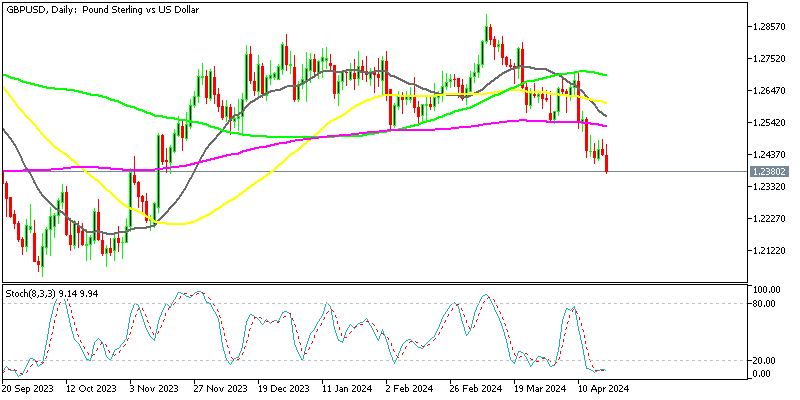
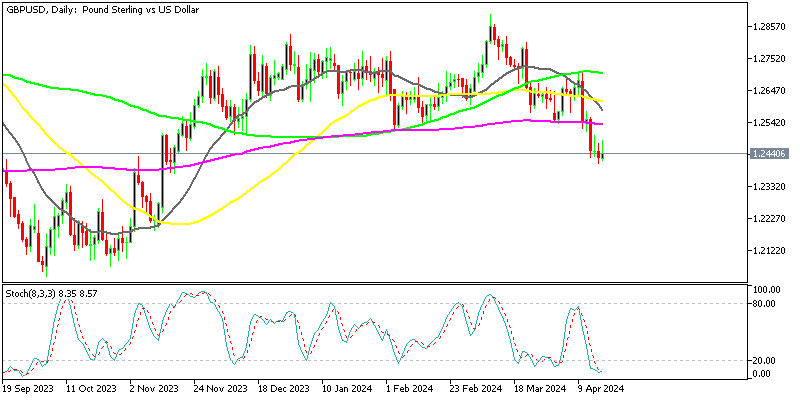
If you switch to the H4 chart time frame, you will see that the 20 SMA comes right at the same level as the 100 SMA on the hourly chart. This strengthens the resistance level which strengthens our case for this sell forex trade. The other forex majors have also completed the retrace against the USD, so the USD might charge back again. Therefore, we might close our AUD/USD signal for whatever profit it is in at the moment.


