Shorting EUR/USD on This Pullback
We opened a forex trade on EUR/USD a while ago. I mentioned it in the midday brief as well, now let’s have a better look at the chart setup

We opened a forex trade on EUR/USD a while ago. I mentioned it in the midday brief as well, now let’s have a better look at the chart setup on this forex pair.
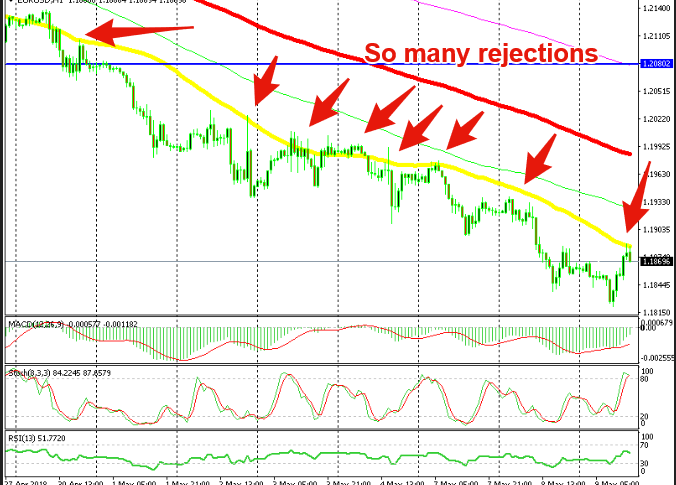
As we know, the downtrend is really strong on this pair. It broke the big level at 1.20, then it was turning to 1.19, which was broken yesterday. Today, the decline continued and it got as low as 1.1820 in the morning.
In the last several hours we are seeing a higher retrace though. The impressive retail sales from Italy this morning helped somewhat, but this is more of a USD pullback because the Buck is in retreat against most major currencies. The rejection of the Iran deal by the US is playing out on forex at the moment.
All pullbacks have been great opportunities to sell this forex pair during the last 2-3 weeks. Therefore, we decided to take this chance and open another sell signal on EUR/USD. We sold this pair just below the 50 SMA (yellow) that moving average has been providing support and it is still scaring buyers.
Besides that, the previous H1 candlestick closed as an upside-down pin which is a reversing signal after a retrace. The H4 chart is not overbought yet, but the 20 SMA (grey) is standing at around 20 pips above the opening price of our signal. So, we have a protection above here just in case buyers have any funny ideas. Although the price is starting to reverse back down, I think we will be alright with this signal.
- Check out our free forex signals
- Follow the top economic events on FX Leaders economic calendar
- Trade better, discover more Forex Trading Strategies
- Open a FREE Trading Account


