Gold Outperforms in Asia – An Update on Gold Trading Signal


On Monday, gold prices soared in response to a softer dollar as investors weighed the chances of fewer interest rate hikes in the United States. Today, we can expect sideways trading in gold on the back of light calendar ahead…
Gold – XAU/USD – Technical Review
During the previous week, gold continued to trade on the tight range of $1,310 – $1,317. But, the precious metal came out of the range, thanks to weaker than expected inflation from the United States for giving a bullish push to gold.
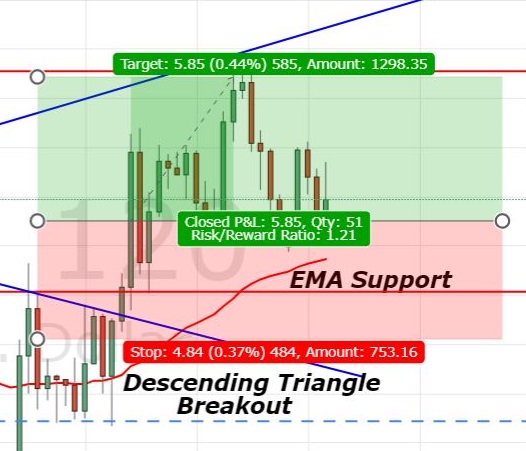
You can see on the 2 – hour chart, gold has violated the descending triangle pattern at $1,317 on the upper side. It placed a high of $1,325 on the breakage of the triangle pattern which is now working as an immediate resistance for gold. Whereas, $1,317 level is working as a support.
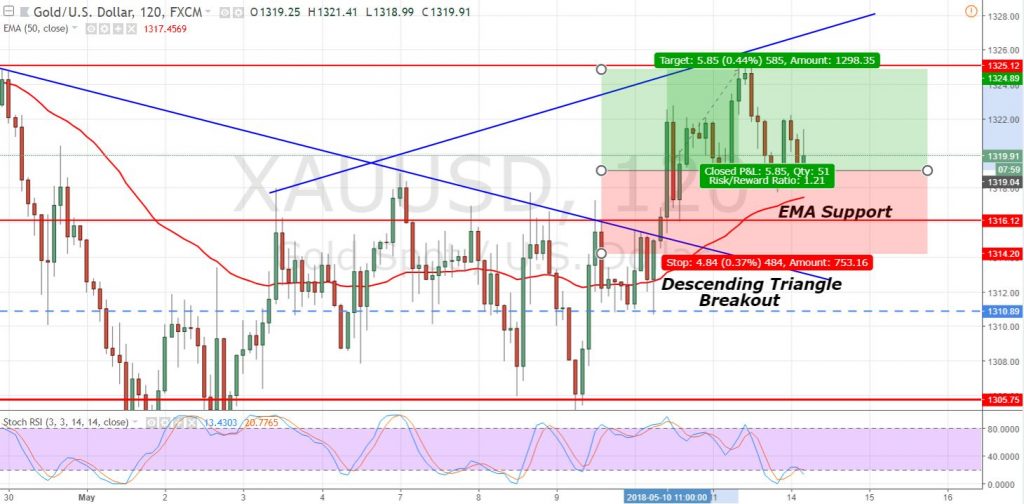
Gold – 2 Hour Chart
The leading indicators RSI and Stochastics have already oversold and investors will be favoring a bullish trade now. Considering this factor, we open a forex trading signal to buy gold above $1,320 to target $1,324 with a stop below $1,317.
Now you can share your views or questions about gold in the comment box below. Good luck and stay tuned for more trading plans.