Two Contradicting Charts in AUD/USD
We have an open forex signal in AUD/USD, if you’re not a member. If you are a registered member with us, you have access to all our signals

We have an open forex signal in AUD/USD, in case you’re not a member yet. If you are a registered member with us, you have access to all our forex signals so you should be aware of this one. We sold this forex pair yesterday as it was retracing higher on the hourly chart. The trend is still bearish and the retrace seemed complete, which was a good opportunity to go short, which we did.
Although, commodity dollars received some bids that day and the pullback stretched further up for this pair. The price eventually returned down yesterday which looked good, but it has been stuck at these levels for about 24 hours now.
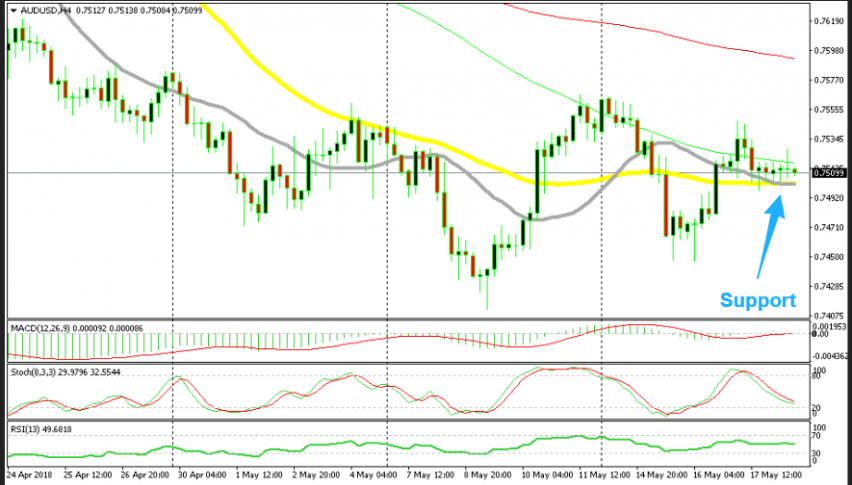
Now, the H4 chart is becoming oversold with stochastic near the bottom of the range. The price has formed a number of pins and dojis down there, which are indicating a reversal. Besides, the 20 SMA (grey) and the 50 SMA (yellow) are standing right below providing support. If these moving averages don’t let go soon, I’m afraid a reverse back up might follow.

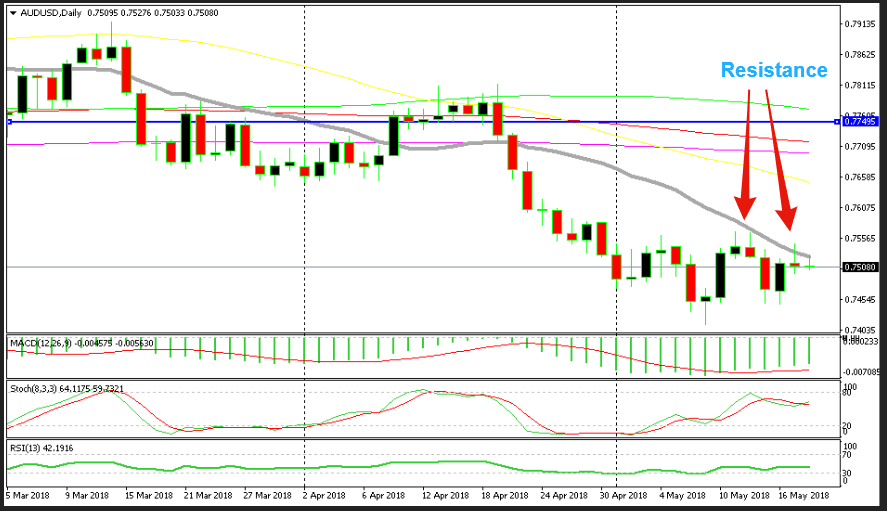
That said, the daily chart is contradicting the H4 chart. On this timeframe, the stochastic indicator is near the top of the range, but that’s not the main bearish indicator. Yesterday’s candlestick as well as today’s one, have formed pins, which are reversing signals. The price went up on Wednesday so the reverse should be on the downside, right?
Besides that, the 20 SMA (grey) stand above here, unlike the H4 chart. This moving average has provided resistance on the daily chart on Monday and it is providing resistance again now that we are approaching the end of the week. Our signal has returned back in profit now, so it looks like the daily chart is having the upper hand now, although we will see as the day progresses.
- Check out our free forex signals
- Follow the top economic events on FX Leaders economic calendar
- Trade better, discover more Forex Trading Strategies
- Open a FREE Trading Account


