
EUR/USD Finding Resistance at the 100 SMA


EUR/USD has been climbing higher since last Thursday but now it has reached a certain level where the buyers seem to have stopped buying. The main trend in this pair is still bearish, so pullbacks higher are good opportunities to go short.
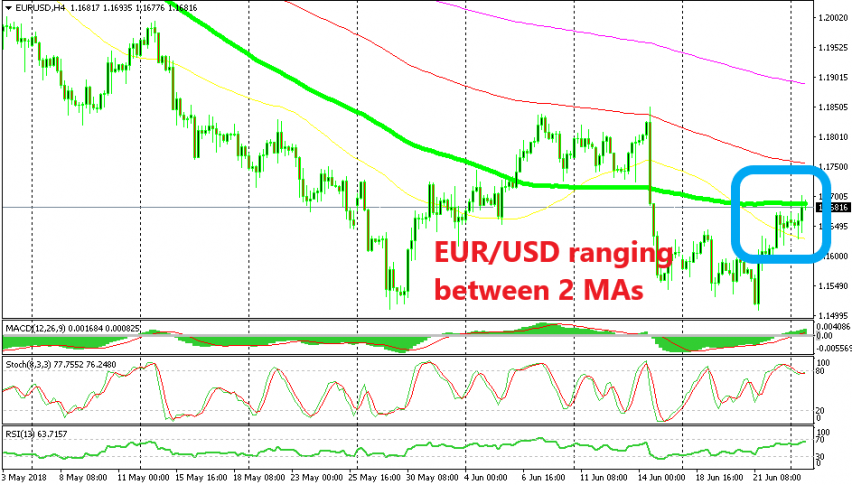
As you can see from the H4 chart above, EUR/USD sellers had a go at the downside this morning, but the 50 SMA (yellow) provided support. The price bounced off of it and continued to climb, but it can’t climb anymore, as the price action of the last several hours has been telling us.
The reason that EUR/USD has stalled at these levels is the 100 SMA (green). This moving average hasn’t exactly been the perfect support and resistance indicator, but now it seems like the 100 SMA is doing that job.
The stochastic indicator is severely overbought. This means that the pullback higher is complete now. After all, the main trend is still down as I mentioned above. We could open a sell signal here, but we already have three open forex signals. So, you have to decide for yourself whether you go short here or not.


