Contradicting Charts in AUD/USD
At the end of last week, AUD/USD made a bullish reversal after having traded in a bearish trend for some time. According to the H1 chart...

At the end of last week, AUD/USD made a bullish reversal after having traded in a bearish trend for some time. According to the H1 chart, the main trend is bearish, but the intraday trend is bullish. Yesterday, we saw AUD/USD slip 50 pips lower. If we take into account the bigger trend, then this should be the beginning of the next leg of the downtrend. If we take into account only the intraday trend which is bullish, then yesterday’s move is merely a retrace before the next move up.
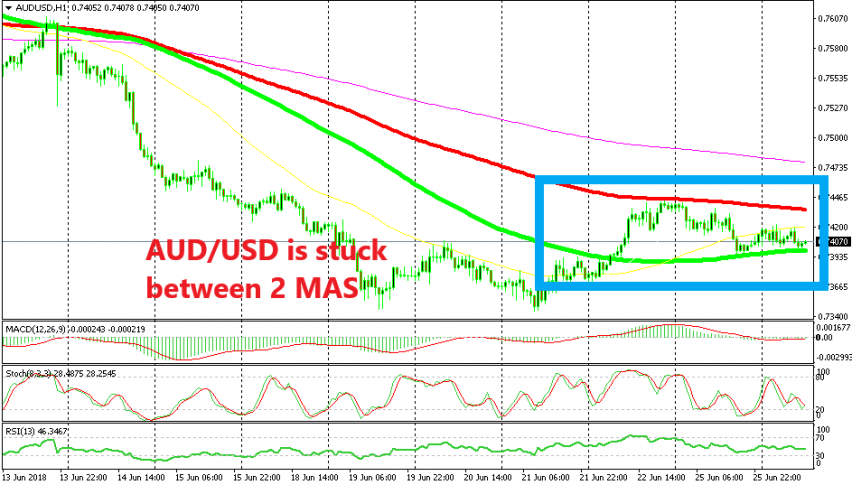
Looking at the H1 chart above, we see that this forex pair has been trading between two moving averages in the last few days. Now, the price is at the 100 simple MA (green) which stands at the bottom. The stochastic indicator is oversold, which means that the bullish move is about to begin, at least until AUD/USD reaches the top moving average which is the 100 smooth MA (red).
But, if we switch to the H4 chart, we see that the bullish move of the last few days is just a retrace of the bigger bearish trend. The buyers kept buying until they reached the 50 SMA (yellow). It seems like this moving average might have been the target for them.

The 50 SMA has been providing solid resistance since Friday
The 50 SMA is moving lower and it is pushing the price down with it. So, there’s a case for buyers and for sellers as well. I would prefer to sell since the bigger trend is down, although I would like to see the price 20-30 pips higher before going short. I will wait for the buyers to take the price higher and the H1 chart to become overbought, and then I will look to sell AUD/USD.
- Check out our free forex signals
- Follow the top economic events on FX Leaders economic calendar
- Trade better, discover more Forex Trading Strategies
- Open a FREE Trading Account


