Gold Violates $1,222 – Quick Update on our Trading Signal


What’s up, fellas.
Gold is trading exactly in line with our forecast Gold Intraday Outlook: Stronger dollar drags gold to one year. It is progressively heading towards our long-term target level of $1,212. Here’s a new trading signal for today…
1) Fed Chair Powells – Hawkish Remarks
One of the major reasons behind a massive sell-off in gold is the hawkish remarks from the Fed Chair Powell. As we know, there’s a negative correlation between the dollar and gold. The dollar rose after upbeat comments on the U.S. economy by the Federal Reserve’s Chairman reinforced expectations by investors of the currency’s long-term strength.
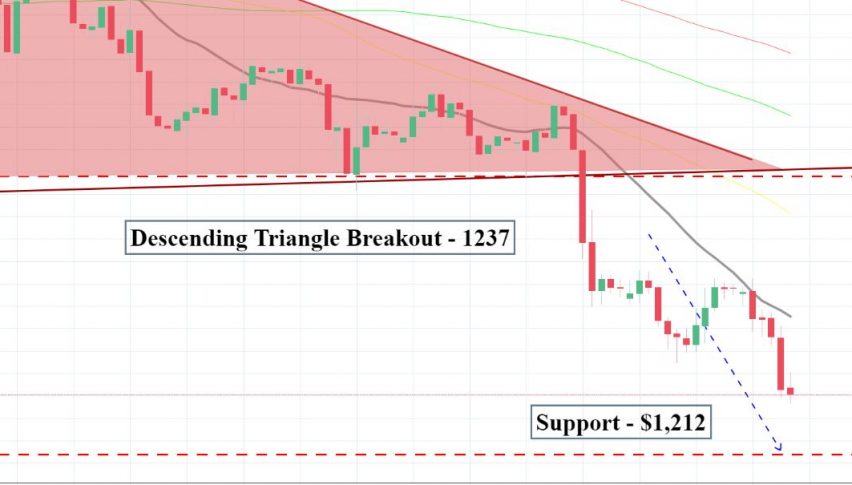
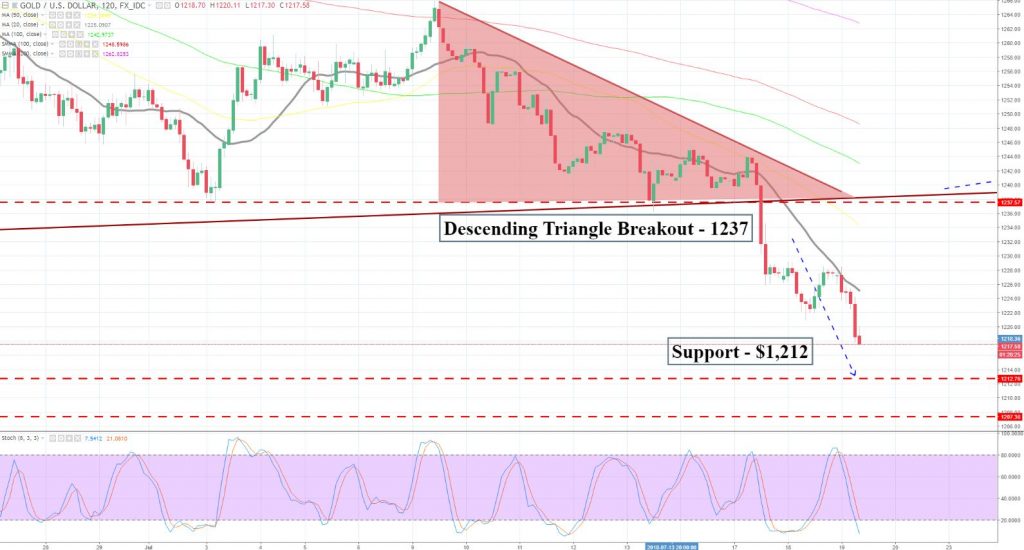
2) Descending Triangle Pattern – Breakout
The second important reason behind a strong sell-off is the violation of sell descending triangle pattern. The market is still trading as per our plan. As you can see on the two-hour chart, gold has come out of the descending triangle pattern and is likely to continue its selling trend until the next support level of $1,221 (already violated this morning) and $1,212. The leading indicators, RSI and Stochastics, are massively oversold yet investors can stay fundamentally bearish until $1,212.
[fxml_more_topcis]
Gold – XAU/USD – Trading Plan
Fellas, we shared a trading signal to stay bearish below $1,222 with a stop above $1,226 and take profit at $1,218. We can also extend take profit to $1,214. Good luck!