Gold Hits Two Take Profits in a Row – Are you Ready for the Next?
The demand for safe-haven assets dampened after the Federal Reserve’s Chairman reinforced expectations of the dollar’s long-term strength. As we know, the rising U.S. interest rates tend to support the dollar and make gold more costly for other holders. Which is why the dollar took a bearish ride. Fortunately, we were able to capture movement both times. Here’s what to expect next…
Gold – XAU/USD – Technical Outlook
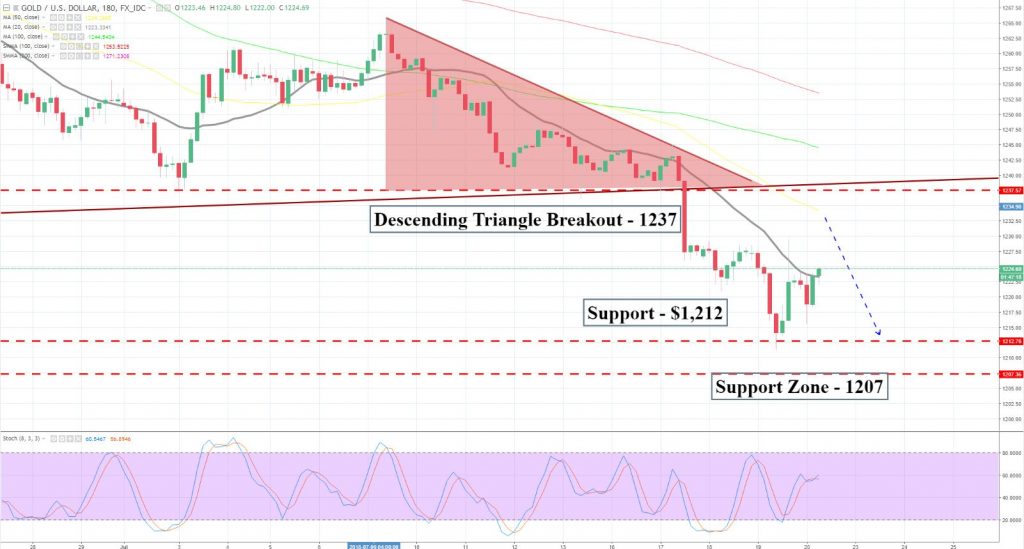
Technically speaking, gold is still in a strong bearish trend. Zooming out the 4- hour chart, gold is trading below 50- periods EMA which is likely to become a hurdle somewhere around $1,223.
Recalling our earlier update, Gold Violates $1,222 – Quick Update on our Trading Signal, we discussed how gold has come out of the descending triangle pattern and is likely to continue its selling trend until the next $1,212. The yellow metal traded inline exactly with the forecast.

What’s next?
Since we don’t have any major event in the United States, we need to rely on the technical indicators. At the moment, gold is testing a solid resistance level of $1,224 on the 3-hour chart and the violation of this can bring more bulls in the bullion market. Gold can gain support at $1,212 and we may see a tug of war between bulls and bears in this range.
Support Resistance
1214.32 1227.62
1210.22 1231.72
1203.57 1238.37
Key Trading Level: 1220.97
Gold – XAU/USD – Trading Idea
Traders, I will closely monitor $1,224 as gold can stay bullish above this with a target of $1,229 and bearish below $1,224 till $1212. Good luck!


