July 20 – Economic Events Outlook – A Good Day to Trade the Loonie


Happy Friday, traders.
Who’s up for trading Canadian dollar now? The economic calendar is entirely packed with Canadian economic data. The commodity currency is weaker and suffering bad demand, especially due to a massive drop in the prices of crude oil and the recent tariff war. Let’s take a look at the top economic events and a trade idea…
Watchlist – Key Economic Events Today
Canadian Dollar – CAD
CPI m/m
Canadian inflation has been performing poorly, putting pressure on the BOC (Bank of Canada) to keep the policy accommodative. In June, the CPI figure came out at 0.1% beating down the 0.4% forecast. Today, the economists are expecting a neutral figure of 0.1% vs. 0.1% previously. Anyhow, it’s worthy to monitor Canadian inflation at 12:30 (GMT).
Core Retail Sales m/m
The figure shows a change in the total value of sales at the retail level, excluding automobiles. Simply, a higher number of retail sales signal a growth in an economy. The Statistics Canada is due to release the figure at 12:30 (GMT) with a forecast of 0.6% vs. -0.1% beforehand.
Traders, since both of these are high impact events and are forecast to be positive (neutral/ better than expected), Loonie is likely to remain supported. The idea is to trade the event only if both figures are positive or both are negative. The release of mixed figures (e.g. CPI positive, retail sales negative) will get you confusion, nothing else.
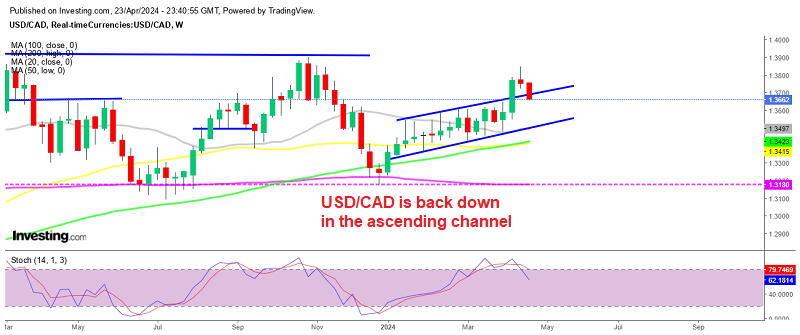
USD/CAD – Ascending Triangle to Play
During the Asian session, Loonie continued to trade bullish above a strong trendline support level of $1.3165. The pair just had a 50- periods EMA bullish crossover on the daily chart. The crossover signals the strong buying intentions of buyers.
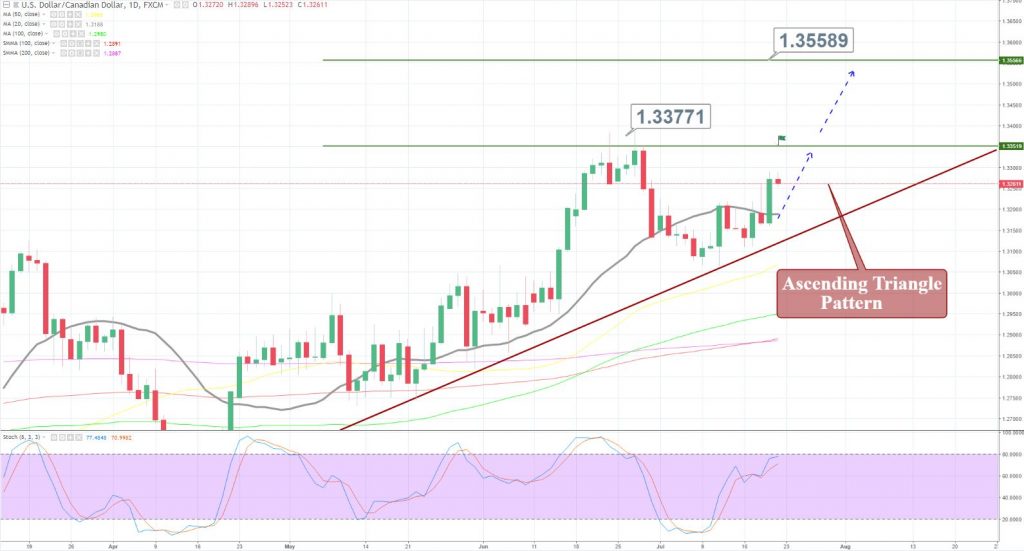
USD/CAD – Daily Chart
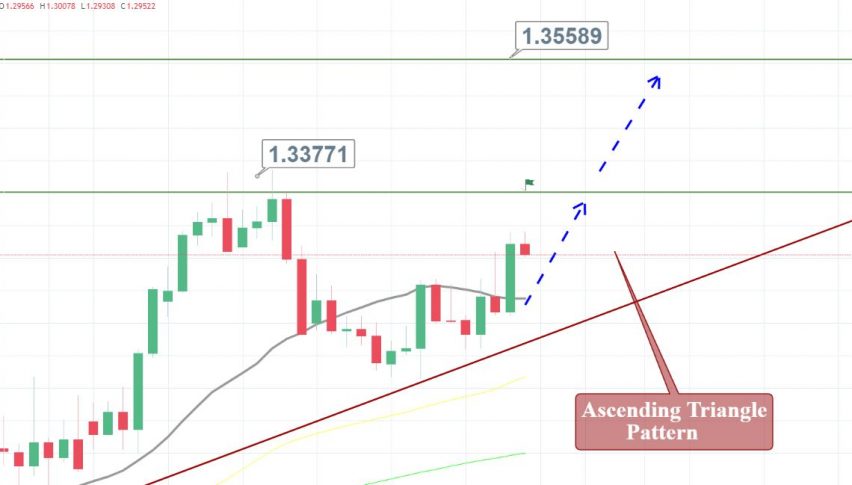
I would also like you to notice the ascending triangle pattern which is providing resistance at $1.3350. The ascending triangle patterns indicate the bullish bias of traders and typically break on the upper side. The USD/CAD can find an immediate resistance near $1.3285 and $1.3350. The violation of $1.3350 can lead commodity currency towards $1.3550.
USD/CAD – Key Trading Levels
Support Resistance
1.3188 1.3286
1.3158 1.3316
1.3109 1.3365
Key Trading Level: 1.3237
USD/CAD – Trading Plan
Ahead of the news, I will be looking to stay bullish above $1.3235 with a stop below $1.3200 and a take profit at $1.3280 and $1.3355. Good luck and have an awesome weekend!