Making Use of the USD/JPY Downtrend Again
Yesterday we opened a sell forex signal in USD/JPY. This forex pair has been trading in a downtrend for the last 7-8 trading days and...
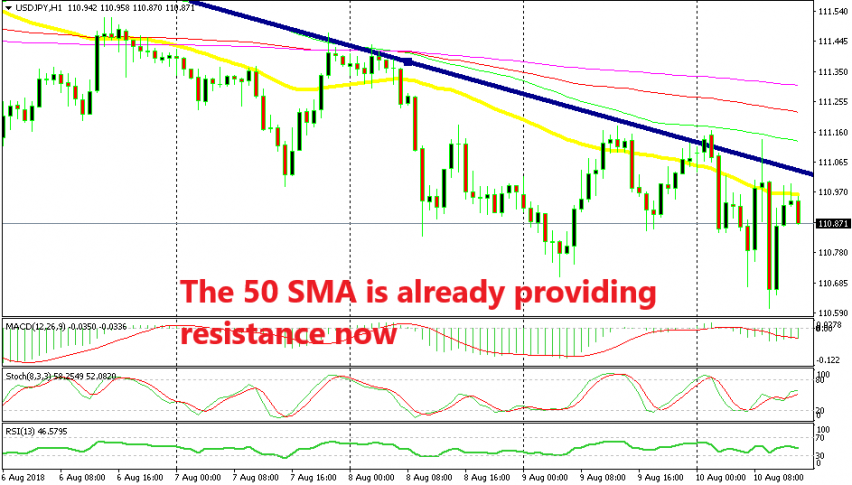
Yesterday we opened a sell forex signal in USD/JPY. This forex pair has been trading in a downtrend for the last 7-8 trading days and yesterday it was retracing higher during the European session. We sold it at the 50 SMA (yellow) on the H1 chart as you can see above. The price pierced above this moving average for a few hours, but the descending trend line held its ground and pushed the price back down. We missed the take profit yesterday in the evening but we got it this morning as USD/JPY resumed the downtrend.
Now USD/JPY is retracing higher again. The price is again banging against the 50 SMA. The buyers might break this moving average again or maybe not, but the trend line still stands and it will likely reverse the price back down if the price reaches it.
The stochastic indicator is not overbought yet, but it will be by the time USD/JPY reaches the trend line if the price keeps moving higher. But, the previous candlestick is already pointing to a bearish reversal. It closed as an upside down hammer which is a reversing signal after a retrace such as in this case.
The current H1 candlestick already looks pretty bearish already, so perhaps the reverse is already underway. The trades we have had in USD/JPY have been successful recently due to the predictability of the downtrend, one more wouldn’t hurt anyone.
- Check out our free forex signals
- Follow the top economic events on FX Leaders economic calendar
- Trade better, discover more Forex Trading Strategies
- Open a FREE Trading Account
- Read our latest reviews on: Avatrade, Exness, HFM and XM
Related Articles


Sidebar rates
Related Posts
