Crude oil breakout the major trendline – Is it a beginning of bearish trend?


On Wednesday, crude oil tumbled more than $2 a barrel after EIA data reported a build in the U.S. crude stockpiles last week. This added worries about a weaker global economic growth outlook.
The move was exactly lined in with our forecast Crude oil inventories due in an hour – How to trade WTI? The U.S. crude oil stockpile rose surprisingly last week, soaring 6.8 million barrels vs. the expectations of a -2.6M draw. The WTI has already met our previous target level of $64.78 and the market is holding right above it.
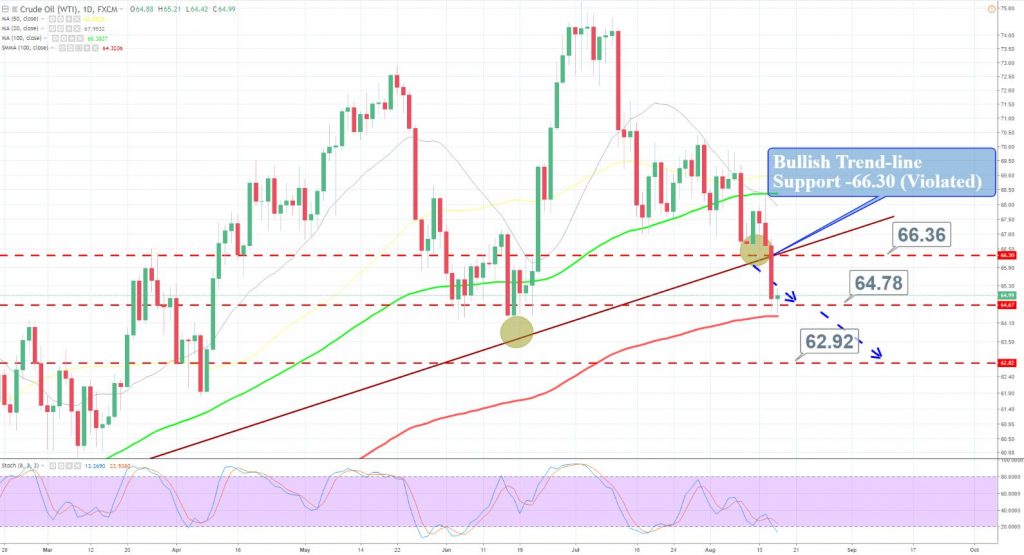
WTI Crude Oil – Daily
As you can see in the daily chart, crude oil has invaded the bullish trend line support level of $66.35. The support level is likely to work as a resistance now. On the lower side, the immediate support can be found at $64.75. Below this level, crude oil can go after 62.95. All the best and stay tuned to our forex trading signals for quick updates.