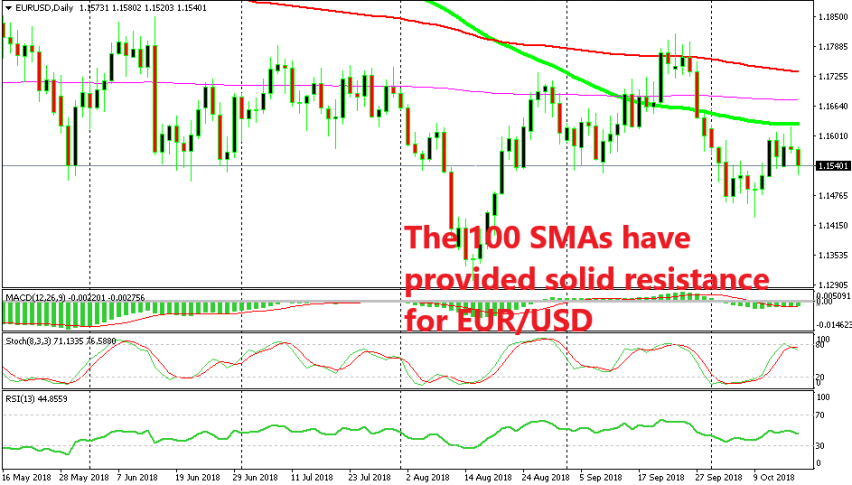


EUR/USD turned bearish by the end of last month and the beginning of this month, losing around 400 pips in the process after it failed to break above the 100 smooth MA (red) on the daily chart. Although, it turned higher again last week, but it couldn’t break the 100 simple MA (green) this time so it didn’t reach the other moving average which stands nearly 200 pips higher.
The stochastic indicator became overbought already by the beginning of this week and the price formed a doji candlestick yesterday. These are two bearish signals on top of the resistance being provided by the 100 SMA (green). Today’s candlestick looks pretty bearish which completes the bearish reversal setup, so EUR/USD seems to be headed lower from the technical analysis of this chart.
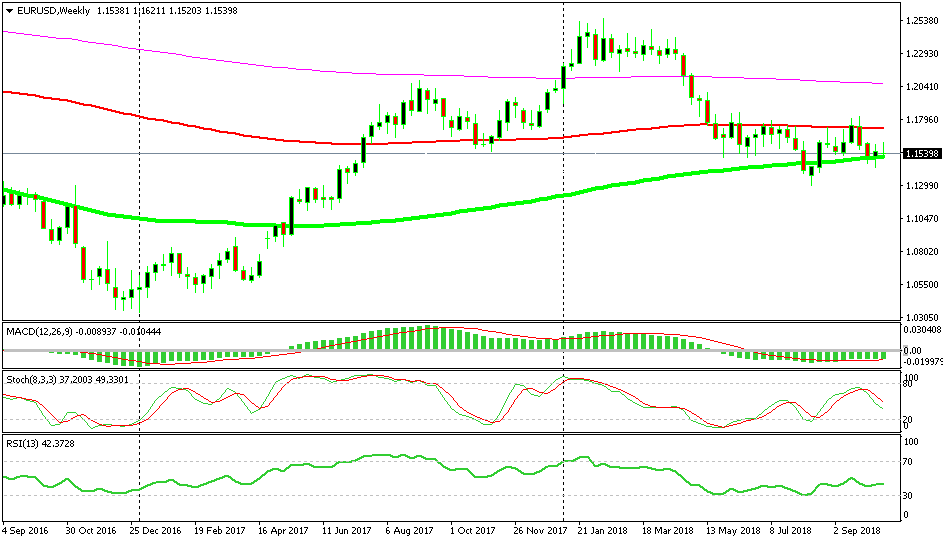
The 100 SMA (green) is working as support on the weekly chart
But if we switch to the weekly chart, we can see a different picture. Here the stochastic indicator is headed down but it is almost oversold, which would mean a possible bullish reversal soon. Besides that, the 100 SMA (green) is providing support for EUR/USD on this time-frame.
Last week’s candlestick formed a doji or an evening star, whatever you want to call it, which is also a bullish reversing signal after EUR/USD trended down for two weeks. So, both charts are contradicting each other, but I think that the pressure is on the downside at the moment, so the daily chart should drive this pair in the next few days at least, if fundamentals don’t ruin things for us.