Fundamentals Might Make This Bearish Chart Setup in GBP/USD Work
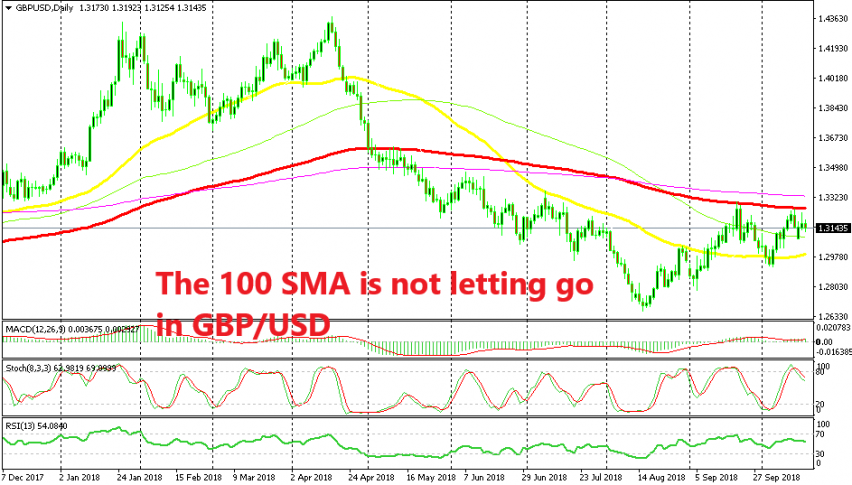
GBP/USD has been retracing higher in the last two months. It has climbed more than 600 pips from the bottom to the top, but it has been finding some solid resistance and, from the chart formation of the last several days, it seems like this forex pair might turn lower now and resume the bearish trend.
The 100 SMA (red) has capped the retraces for GBP/USD in the last two months. Last month, this moving average rejected the price just below 1.30. But, the buyers returned again after a refresh and this pair climbed back up to the 100 SMA at the end of last week.
Although, the sellers got cold feet at the 100 SMA once again and we are seeing GBP/USD form a bearish reverse setup on the daily charts. The fundamentals are also pointing down for the GBP.
Despite the increase in earnings yesterday, the CPI (consumer price index) inflation report that was released this morning was quite soft, to be honest. At 2.4%, inflation in UK still remains higher than in most developed economies, so today’s soft numbers won’t send GBP/USD to 1.30 immediately, but they add to the soft fundamental tone for this pair.
From what we have been hearing from UK and European politicians, it seems like there won’t be a Brexit deal in this week’s EU summit. It will be postponed for November or December by the looks of it, but we should see an official comment confirming that in order for GBP bears to become active. So, perhaps not today, but in the near term I see GBP/USD at 1.30 and then below it.


