EUR/USD On The Slide Ahead Of U.S. GDP (Q3)


October has been a month to forget for EUR/USD bulls. Values have plummeted more than 250 pips and the selling does not yet appear over. Rates have fallen beneath the 1.1400 handle, pushing session lows toward 1.1350. Is there any relief in sight?
The short answer is no. An about-face toward policy from the ECB, as well as rekindled optimism toward the Greenback, have prompted a mass exodus from the Euro. In fact, if an exceptionally strong U.S. GDP (G3) report is released tomorrow, then the damage may get even worse.
EUR/USD Technicals
In a previous update, I talked about how Friday’s U.S. Core Personal Consumption (Q3) and GDP(Q3) reports may send the USD/CAD directional. The same goes for the EUR/USD ― a 3.5% or 4% GDP (Q3) figure will likely bring 1.1300 into play.
+2018_10_25.png)
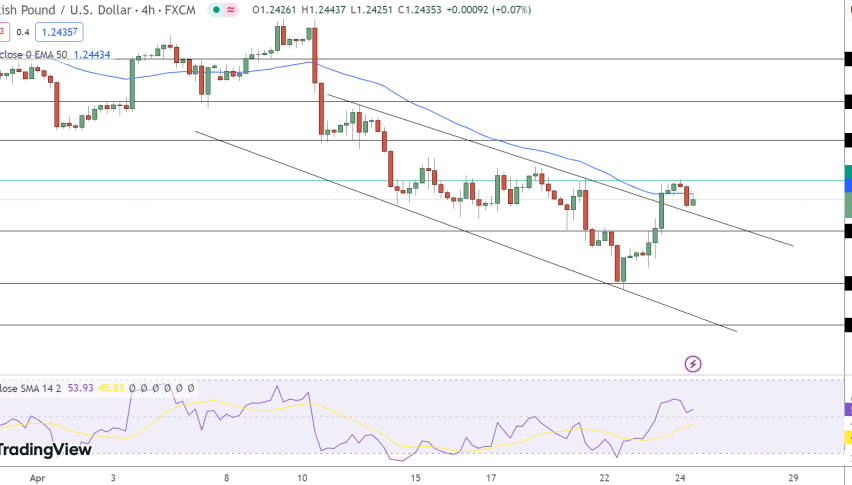
Overview: The August low of 1.1301 is a big support level for this market. Notice the Doji pattern that set up on August 15 ― price rapidly rejected the 1.1300 level, formed a daily Doji, and then put in a 500 pip rally. Is this scenario poised to repeat itself? Amid a tightening FED policy on the table for Q4, the short answer is no.
Aside from being a psychological barrier, 1.1300 has little technical significance. However, it has withstood one test and is certainly a big-round-number on the radar of many forex players. In the event that tomorrow’s U.S. economic metrics exceed expectations, the 1.1300 level may be tested yet again.