Oil Is Breaking the Second Barrier As It Turns Bearish
Crude Oil has been on a bearish trend for 2.5 years, but it has broken the trend and turned bearish now. It faces obstacles in the way now.

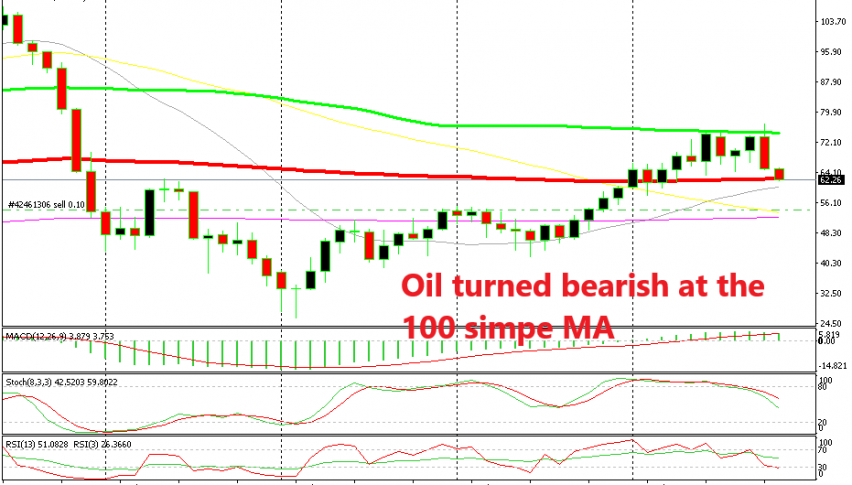
WTI Oil has been trading on a bullish trend for two and a half years after bottoming out at $26/barrel in 2016. The uptrend picked up pace since summer 2017 and approached the $78 level last month. But, the 100 SMA (green) provided solid resistance for several months. It go pierced last month as buyers tired one last push to the upside, but they eventually gave up and Oil returned back below that moving average, so it doesn’t count as a break.
This discouraged the buyers and eventually, Oil turned lower last month after failing to break the 100 SMA. The first test for sellers on the monthly chart is the 100 smooth MA (red). It has been providing support throughout the year and it is under attack now. The price has move below, but the monthly candlestick needs to close below it to count as a break.

The 100 SMA is within reach but stochastic is already oversold
Switching to the weekly chat, we see that the trend has finally been broken here. The 20 SMA (grey) was defining the trend and acting as support, pushing the price higher but now that moving average is history. But, the 200 SMA (purple) has also provided support earlier this year, so that was another test for buyers.
But once again, they pushed WTI Oil through it and through the 50 SMA (yellow) like a knife through butter. But now, the next test is at the 100 smooth MA (red) which provided support once in February this week, which lie around 100 pips lower at $61. Let’s see if the sellers will be able to push below that moving average, but the current price action, points o some more bearish momentum for the coming weeks.
- Check out our free forex signals
- Follow the top economic events on FX Leaders economic calendar
- Trade better, discover more Forex Trading Strategies
- Open a FREE Trading Account


