Gold Made a Quick Reversal Last Week but now Faces the 50 SMA
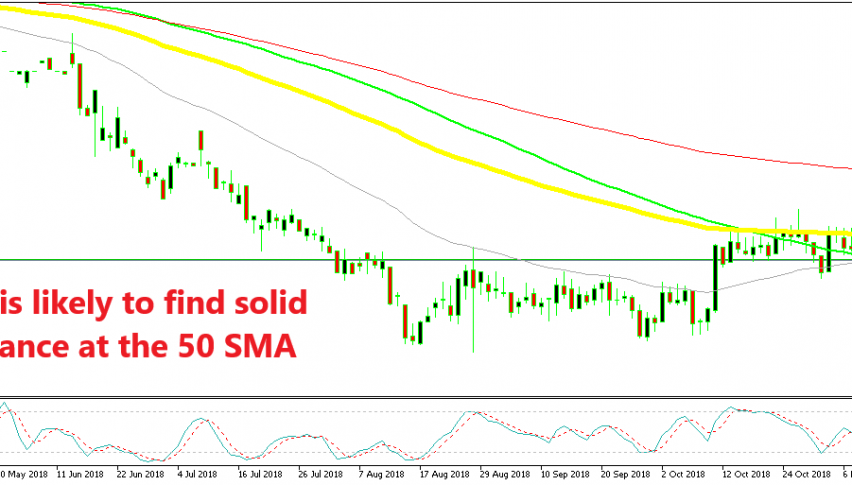
Gold had been trying to break above the 50 SMA (yellow) for nearly a month since the middle of October until mid November but without much success. The price pierced that moving average many times but it returned down every time to close the daily candlesticks below it.
The buyers eventually gave up as the sentiment improved in financial markets after the US midterm elections and the FOMC statement during the second week of this month. By the way, the FOMC statement showed that the FED is keeping the current path on the monetary policy and the same pace of interest rate hikes.
So, Gold turned bearish and lost quite some ground pretty quickly. It broke below the $1,200 level on Tuesday last week but it reversed just as quick. That doji candlestick last Tuesday was a giveaway, but the trend was bearish so we remained on the sidelines.
Now, Gold is headed back up towards the same moving average. If Gold gets to the 50 SMA, we will get another chance to sell it up there and target a few hundred pips. That is a really strong resistance indicator and, even if the price might not turn bearish and lose hundreds of pips, it is highly probable that it bounces off the 50 SMA in the first attempt, which would give us a bunch of pips.
By the time the price gets there, the stochastic indicator will be overbought as well which means that the bullish move will be complete on the daily chart.
Although, as you might now by now, I like to get a confirmation that the price is about to reverse down. I get these confirmations from the candlestick formations, usually dojis, pins and hammers. So if the price forms one of these candlesticks at the 50 SMA , then that would be the sign to go short.


