USD/CAD Back at That Place Again
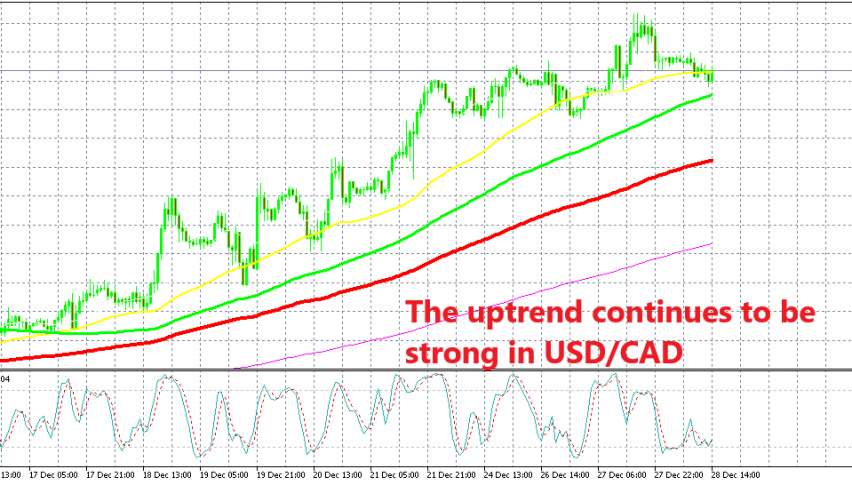
USD/CAD has been retracing lower in the last two session but the retrace seems complete now so we decided to use this chance.

Yesterday we opened a buy signal in USD/CAD as this pair was retracing lower. The price was finding support at the 50 SMA (yellow) on the H1 chat and the 20 SMA (grey) on the H4 chart. As we mentioned yesterday, the price hasn’t been respecting the 50 SMA on the H1 time-frame exactly to the pip and we are seeing the same thing today.
The price has pierced the 50 SMA but it is not moving too far below it, so it is finding support in the area surrounding this moving average. The stochastic indicator is now oversold as well which means that the bearish retrace is complete, so we decided to go long.

The 20 SMA has been pushing USD/CAD higher in the last two weeks
Then I switched to the H4 chart time-frame. On this chart we see that the 20 SMA (grey) has been providing support during dips in this pair and it has been pushing USD/CAD higher. This means that the uptrend has picked up pace, because USD/CAD buyers are not waiting for larger period moving averages to catch up, instead, they are jumping in at the first possible support indicator which in the last two weeks has been the 20 SMA.
The current H4 candlestick looks like a doji at the moment which is a reversing signal. If this candlesticks closes like this, then I expect the bullish reversal to take place soon and USD/CAD will resume the uptrend in that case.
- Check out our free forex signals
- Follow the top economic events on FX Leaders economic calendar
- Trade better, discover more Forex Trading Strategies
- Open a FREE Trading Account


