Gold Attempts to Break the Triangle to the Downside as Market Sentiment Improves
We have covered GOLD pretty often in the last few days but it’s not us, it’s Gold. It has been bouncing up and down in what seemed to be a range at first, but then it turned out to be a triangle. One moment it looked like Gold was going to turn bearish, the next one, Gold threatens the top side, so it’s been pretty volatile, hence our intensive coverage.
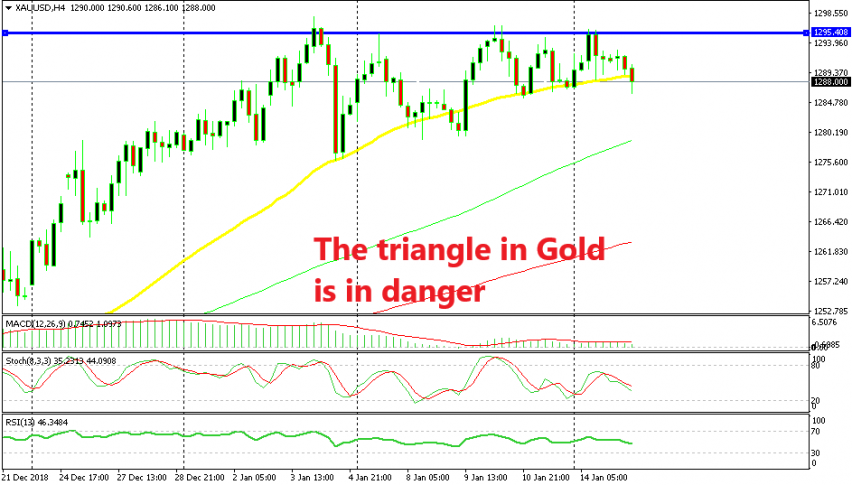
The top of the triangle has been defined by the resistance zone around the $1,295 level, while the ascending line at the bottom of the triangle has been defined by the 50 SMA (yellow) on the H4 chart. The 50 SMA has been a solid support indicator during this period as we have highlighted it often.
The price has bounced off this moving average many times and the triangle kept getting narrower as the 50 SMA kept moving upwards. But, the triangle was bound to break at some point and it seems like it is going to break to the downside.
The price has slipped below the 50 SMA now but the H4 candlestick is not closed yet. Until the current H4 candlestick closes below it, the break is not valid. So, we have to wait and see if sellers manage to keep the price below the 50 SMA until then.
Market sentiment has improved somewhat today as stock markets move higher while the JPY moves lower, so this might as well be a real break. If this is genuine, then we should expect some more downward pressure in the coming sessions, but let’s see if the break will be real first. We already have a sell signal here, so we are on the right side for the moment.


