Gold Bound to Fail at the 100 Monthly SMA
Gold has been on an uptrend for a few months, but that uptrend might be over soon as all charts indicate
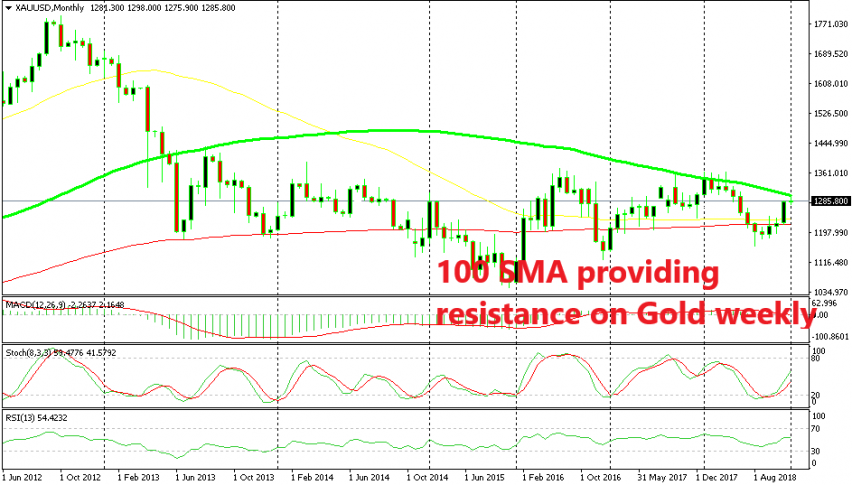
Yesterday we took a look at the weekly chart of GOLD. Gold turned bullish in August last year, after it had failed to break the 100 SMA (green) on the monthly chart at the beginning of 2018. It climbed up close to $1,300 last week, but it started slipping lower on Friday.
That raised an eyebrow because the $1,300 level is a big round level, so perhaps that was the target for the buyers. Now that they have reached it, they are turning the tail and reversing the trades to short. Although, that was just my reasoning after seeing the reverse on Friday at that major level.
The weekly chart showed that Gold had formed three doji/hammer candlesticks in the last three weeks up there, so that was another reason to think that perhaps that was it for the bulls, and that now the sellers are getting in the game. But, I have to look at all chart time-frames.
So, looking at the monthly chart, we get another confirmation that a bearish reversal might be on the way for Gold. Gold has run into the 100 SMA once again now and it seems like this moving average is providing resistance again.
The stochastic indicator is not overbought yet, but it is getting there, so this recent bullish move might as well have ended, or will end soon, according to all charts. Particularly if this month’s candlestick closes as a doji, pin or hammer, that would be another strong signal which would indicate a bearish reversal soon, probably next month. So, we are keeping an eye on GOLD.
- Check out our free forex signals
- Follow the top economic events on FX Leaders economic calendar
- Trade better, discover more Forex Trading Strategies
- Open a FREE Trading Account
- Read our latest reviews on: Avatrade, Exness, HFM and XM
Related Articles


Sidebar rates
Related Posts
