USD/CAD Challenges 38% Fibonacci Level


Fibonacci numbers are applied to active trading in a variety of ways. Retracements, circles, expansions, and time extensions are a few of the most common. Without a doubt, Fibonacci tools have an enormous fan base among active traders.
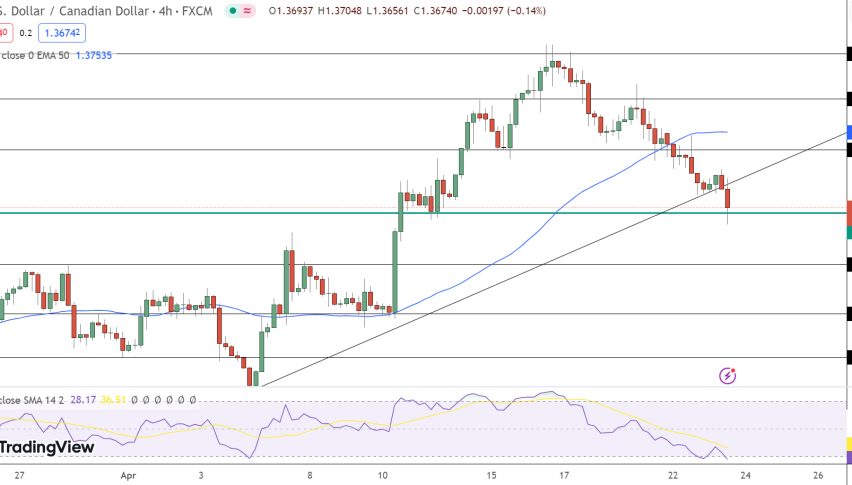
Over the past week or so, I have highlighted the importance of a key 38% Fibonacci retracement level (1.3366) for the USD/CAD. Over the last 24 hours, it has been under siege by bidders and has held its ground.
USD/CAD Technical Outlook
On the daily chart, the USD/CAD shows an obvious bearish trend followed by a measured retracement. Buyers are in the process of challenging the late-2018/early-2019 plunge. In the event the 38% Current Wave Retracement (1.3366) continues to prove valid, this market will likely gravitate toward the Double-Bottom (1.3180-83) over the intermediate-term. If not, the odds of a meaningful recovery increase exponentially.
+2019_01_241.png)
Overview: One week ago, I issued a trade recommendation for shorting the USD/CAD. The short position turned out to be a success. If you missed the article, check it out here.
The next week is going to be a pivotal one for the USD/CAD. GDP, Core Personal Consumption, and a FED policy statement are the primary market drivers scheduled. Participation levels are certain to be strong. Without a doubt, the 38% Fibonacci retracement (1.3366) level is one to remain aware of moving forward.