Selling EUR/CHF at Moving Averages
EUR/CHF has retraced higher today after the major bearish move yesterday, but the retrace might be over soon.
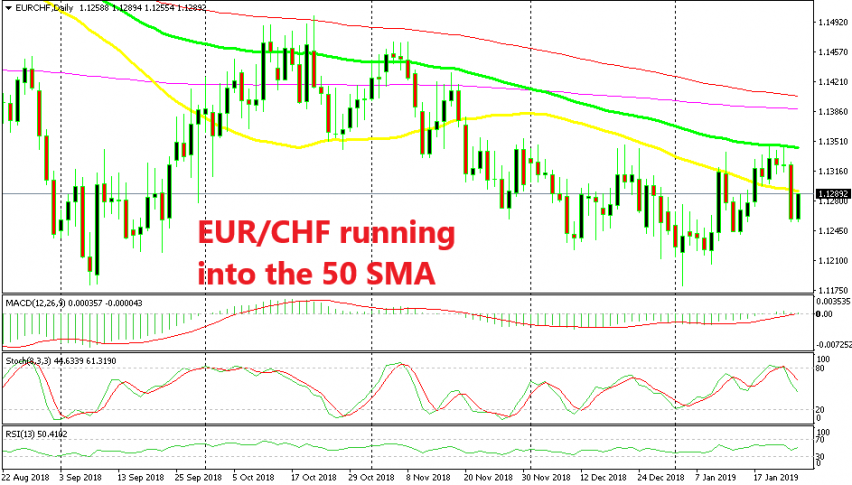
EUR/CHF turned bearish yesterday, as you can see from the daily chart above. It failed to break the 100 SMA (green) which provided solid resistance today and the price formed a doji candlestick on Wednesday, which is a strong reversing signal.
The stochastic indicator was overbought as well, which indicates the retrace higher of the bigger bearish trend that started back in October last year. That was the perfect bearish reversing chart setup, but the decline came after comments from the Swiss National Bank chairman who said that intervention and rhetoric from the SNB hasn’t been enough to keep the CHF subdued.
Well, the sentiment has been deteriorating in financial markets during last year as the global economy weakened, which leaves safe havens in a good position since they attract lots of bids during such conditions. As a result, EUR/CHF tumbled lower and lost around 70 pips yesterday.
Although today, we see that this pair is retracing higher. We decided to sell this retrace as the price runs against the 50 SMA (yellow) on the daily chart at the top of this article. That moving average has been providing support before and now it is supposed to turn into resistance.
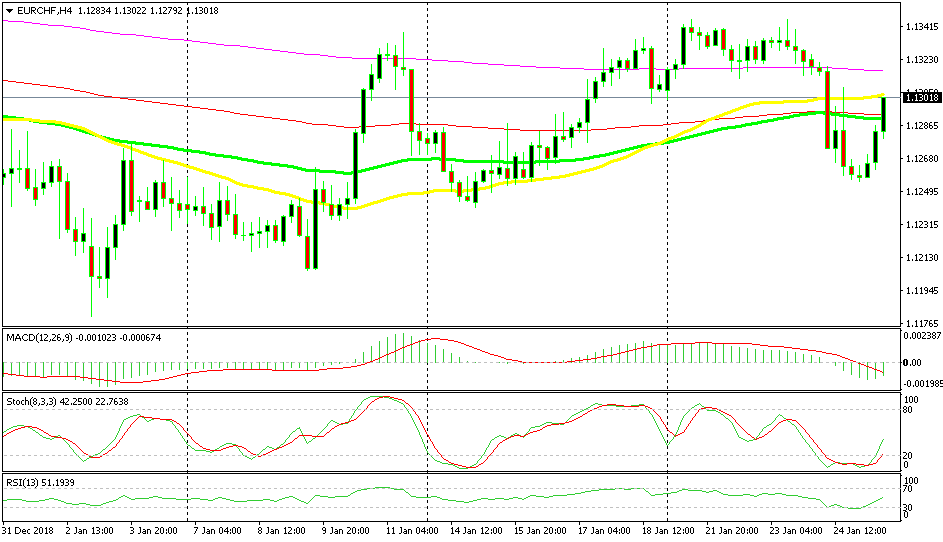
The 50 SMA is back into play, this time the price coming from the downside
On the H4 chart, the price is at the 100 simple (green) and smooth (red) MAs. Although, it has pushed a few pips above now, but the 50 SMA is the one providing resistance now. That is a stronger indicator since it has provided support and resistance many times before and it stands at 1.13 which is a big round number, thus a resistance level in itself. So, we’re hoping that the retrace ends here and the bearish trend resumes again soon.
- Check out our free forex signals
- Follow the top economic events on FX Leaders economic calendar
- Trade better, discover more Forex Trading Strategies
- Open a FREE Trading Account
