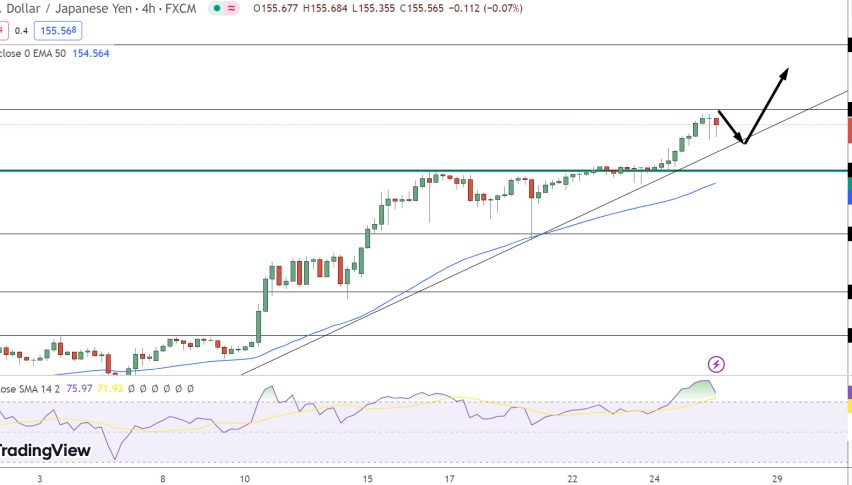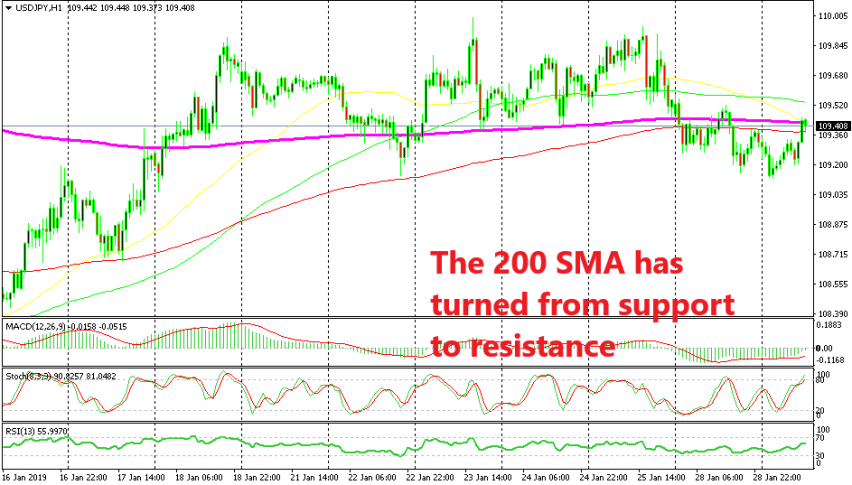
Once Support, Now Resistance – Shorting USD/JPY at the 200 SMA


USD/JPY turned really bearish at the end of last year and it crashed more than 4 cents lower in the first trading days of this year. In total, this forex pair lost nearly 10 cents in the last few weeks from the middle of December until the beginning of this month.
It reversed back up during since the first week of this month, recuperating around 5 cents, but the retrace higher stopped right at 110 last week. Although, the 200 SMA (purple) turned into support lat week and it held the decline for several days, despite being broken once briefly.
Eventually, the buyers gave up last Friday after failing to break above the big level at 110 and yesterday, the 200 SMA finally gave up. This moving average was put back to test as resistance immediately after the break to the downside, but it resisted and the price slipped lower to 109.10s.
Now, we see that the price is back up here at this moving average. The stochastic indicator is overbought which means that the retrace higher is complete and the 50 SMA (yellow) has now joined the 200 SMA, so they should provide some decent resistance. With this chart setup in front, we decided to go short on USD/JPY around here. Now let’s see if this moving average will resist once again.