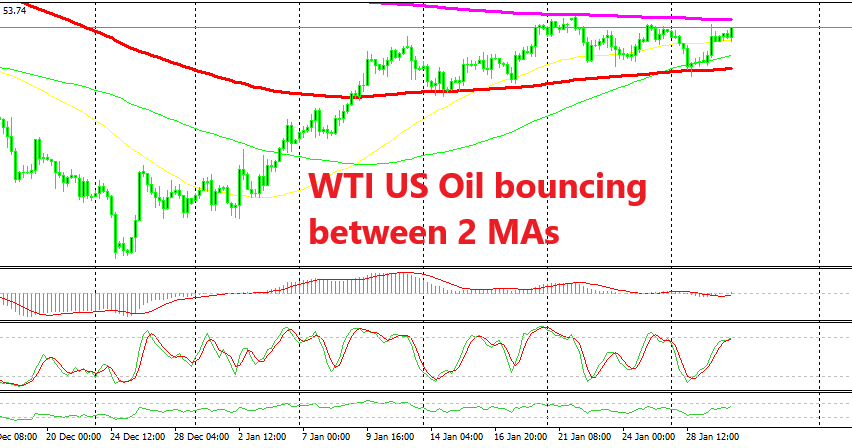
Oil Still Bouncing Between These 2 MAs


Yesterday in the morning I posted an update about Crude Oil and how it turned bearish from the top of the range and reached the bottom of the range which once again held, keeping WTI Crude Oil range bound. Oil formed a doji candlestick on the H4 time-frame chart and then reversed back up. Too bad we didn’t take that trade.
The range in US Oil has been defined by two moving averages on this chart. At the bottom, we have the 100 SMA (red) which has been providing support during the last three weeks. At the top, the 200 SMA (purple) has provided resistance during the last two weeks.
Right now, the price is near the top below the 200 SMA and the stochastic indicator is overbought. This means that the bullish move is almost complete. This chart setup looks good to go short on Oil, but I would like to see US Oil a bit higher, and closer to the 200 SMA which would give us a better risk/reward ratio, so we will be following Crude Oil closely in the coming hours.