The Bearish Retrace Continues in Gold, but Until When?


GOLD broke above the resistance at $1,296 as well as above the big round $1,300 level. It also broke above the 100 simple moving average on the daily chart if you want to check that out. So, that was a multiple break of several long term indicators.
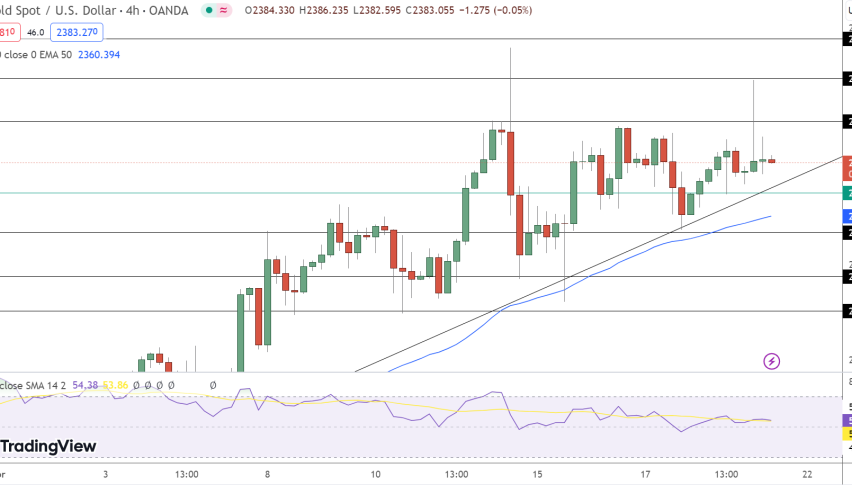
That took gold above the 61.8% of the Fibonacci retracing level connecting the swing high from last year with the swing low in August, so the downtrend which started in spring last year is now officially over. Gold reached as high as $1,326 on Thursday last week, but it has been pulling back lower since then.
I mentioned a few days ago that Gold formed an upside-down hammer candlestick on the daily chart that day which is a strong reversing signal and now we find Gold more than $20 lower from the top. If the trend might change, then this is just a retrace, right?
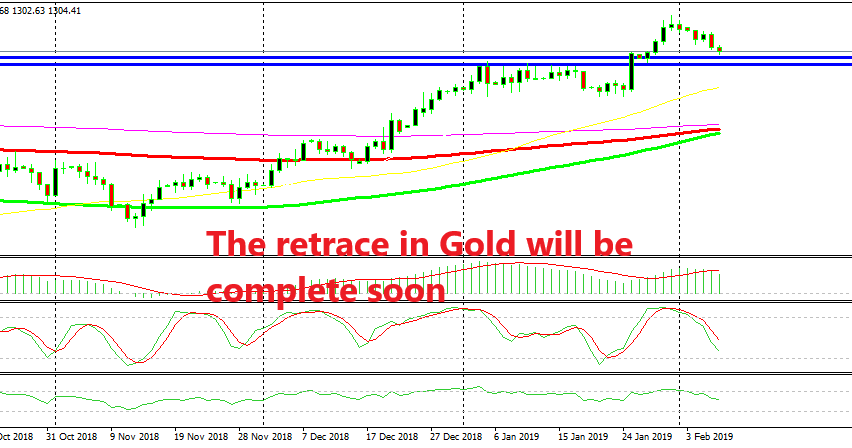
If it is a retrace, where will it end? The $1,300 level (the first blue line) is the first place to see if the sellers start to have trouble. If they do, then that level might be the reversing point. Or at least, it will be good for a short term buy trade, trying to get some pips on the initial bounce.
Otherwise, if $1,300 gets broken, then the $1,295-6 level (the second blue line) will be another good place to look for longs. If we get a reversing signal down there such as a doji or a hammer, than that would be good enough for buyers. By that time the stochastic indicator will be oversold and the retrace will be complete.