Shorting USD/JY Below Moving Averages
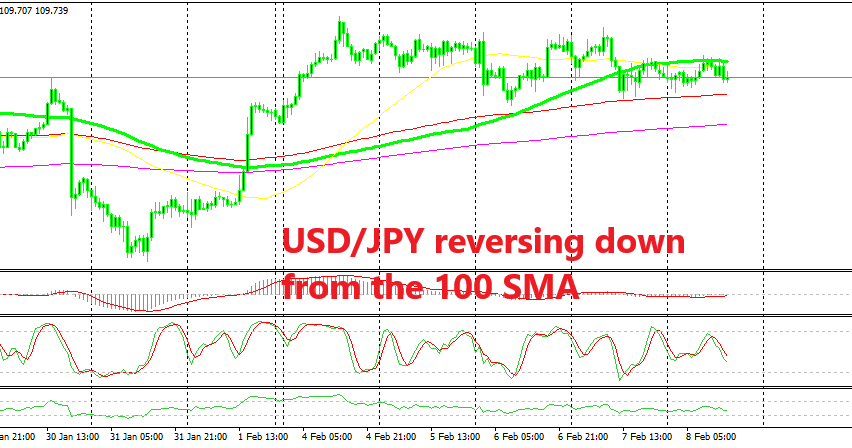
USD/JPY failed to break above the 100 H1 SMA an it is reversing lower. We decided to sell this pair on this chart setup.
USD/JPY has been pulling back higher since the first week of January after the big decline that sent this pair around 10 cents lower in December. Although, this week we have seen this pair trade in a tight range around the 100 smooth moving average (red) on the H4 chart.
This mans that the buyers are reluctant to push any higher too far from this moving average. The buyers are finding it hard to push above the 110 level and make a clear break of this major level. For this reason, we decided to try the short side from here.
On the H1 chart above, we can see that this forex pair has been finding solid resistance today at the 100 simple moving average (green). The buyers tried to push the price above this moving average but they failed and USD/JPY started reversing lower.
The stochastic indicator was overbought a few hours ago when we opened this signal. This meant that the bullish move was running out of steam as USD/JPY became overbought on the H1 time-frame chart. Now, this pair is reversing back down as we head towards the end of the week which means that traders will find some comfort in safe havens.
- Check out our free forex signals
- Follow the top economic events on FX Leaders economic calendar
- Trade better, discover more Forex Trading Strategies
- Open a FREE Trading Account
- Read our latest reviews on: Avatrade, Exness, HFM and XM
Related Articles


Sidebar rates
Related Posts
