Watch For Further Gains in Oil as US Crude Overcomes the 100 Daily SMA
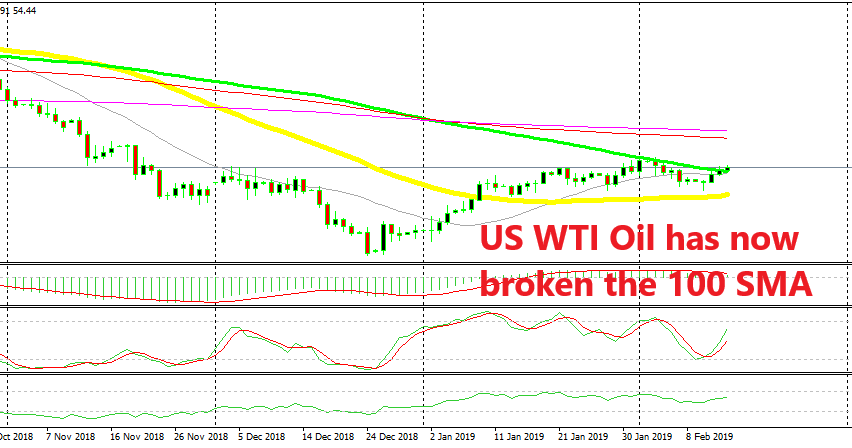
Crude Oil made a bullish reversal at the end of last year and it has been trading on a bullish trend for more than a month. US WTI crude climbed around $13 during this time, but the price reached the 100 SMA (green) on the daily chart which provided resistance and offered a pullback for Oil.
This moving average used to provide support to the US WTI crude during the first half of 2018 when Oil prices were still on an uptrend. But such indicators turn to the opposite of themselves when the trend changes, so it turned into resistance and stopped the climb in Oil late in January.
The price retraced lower last week and reached $51.22 on Monday. I thought that we would reach at least the $50 level which is a big round level and where we can also find the 50 SMA (yellow) on the daily time-frame, as you can see from the chart above. I would have gone long on Crude Oil at that level.
But, the buyers came back earlier than I thought and WTI reversed higher again. The stochastic indicator was oversold, which meant that the retrace lower was complete and the daily candlestick closed as a pin on Monday, which is a bullish reversing signal after the pullback.
Now, Crude Oil has resumed the bullish trend and yesterday’s candlestick closed above the 100 SMA which confirms the bullish bias. The USD turned bullish yesterday and made some decent gains which should have been reflected in Oil prices, sending them lower, but crude Oil is still climbing meaning that the buyers remain in control.
Now, the first target for buyers is last month’s high at $55.60s and then we head for the next two moving averages at $58.40 and $59.40, and eventually the $60 level. This is what the charts are telling us, so let’s see if Crude Oil will follow the technicals.


