Crude Oil Breaks the 100 SMA on the Daily Chart, But Faces the 20 SMA on the Weekly Now
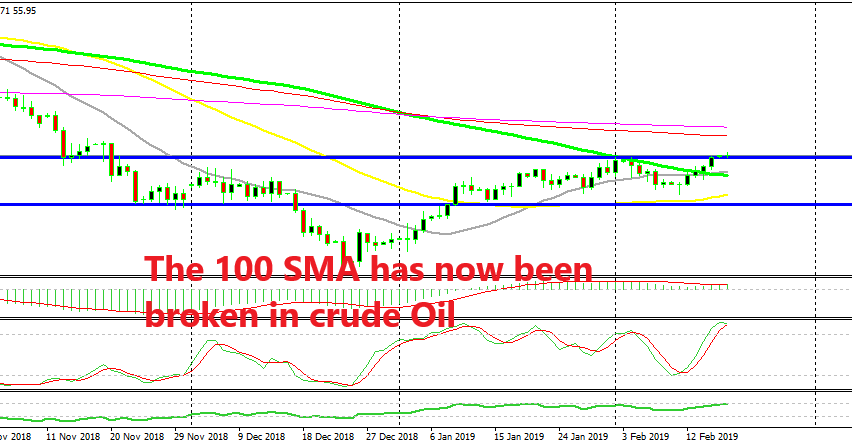
Crude Oil made a bullish turnaround at the end of December last year after forming a doji candlestick on the weekly time-frame as you can see from the chart below. But, US WTI crude found resistance at the 100 SMA (green) on the daily chart at the beginning of February and it retraced lower during the first week of this month.
Although, the retrace was complete by Monday last week as stochastic became oversold while the price formed a doji candlestick on the daily chart, which is another bullish reversing signal after the pullback. So, last week was pretty bearish for Oil and it broke above the 100 SMA on Thursday.This was a confirmation, signalling that the bulls were in control in Oil and the uptrend was bound to stretch further. The buyers pushed higher indeed and the price took out the previous high at $55.70 today, pushing up to $56.30. So now, the previous high at $55.70 has turned into support.

The 20 SMA is now providing resistance for US crude Oil
Although, if we switch to the weekly time-frame, we can see that the 20 SMA (grey) has up with the price now and it is providing resistance. This moving average provided resistance to US Oil for some time during 2017 but then turned into support, holding the pullbacks during the uptrend last year. Now it is coming down from the top side again which means that it should provide some resistance. So, we have two moving averages contradiction each-other on different time-frames. Let’s see which one will win this battle.


