Resistance Holds for Bitcoin and the Daily Chart Points Increasingly to a Bearish Reversal
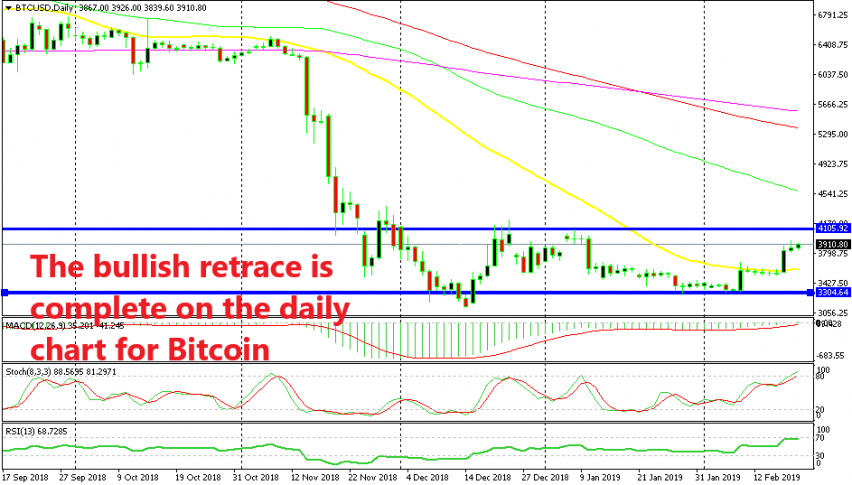
As we have mentioned a few times recently, cryptocurrencies made a bullish reversal in the last two weeks after trending down for more than a year in what turned out to be an epic trend reversal. The reversal in BITCOIN unfolded in two waves, first on Friday two weeks ago when Bitoin pushed to the 50 SMA (yellow) on the daily chart and the second on Monday this week when the buyers finally pushed above this moving average for the first time since September last year.
Bitcoin made new highs yesterday, pushing to $3,952 on my platform, although there is price differentiation among the brokers and I saw somewhere else that the high yesterday reached above $4,000. Although, that doesn’t change much because the resistance level is at $4,100 which has a buffer zone around it stretching from $4,000 to $4,200.
One thing which is different from yesterday when I posted the Bitcoin update is the fact that yesterday’s candlestick closed as an upside-down hammer, which is a reversing signal. Besides that, the stochastic indicator is now well overbought on the daily chart as you can see above, so this bullish move is complete.
But, the buyers are still trying to to push higher today and Bitcoin is slowly grinding higher. Although, the bullish momentum has faded now and the price action is really slow. This sort of price action also points to a bearish reversal, but the reversal might take some time to come because that’s how cryptos move – they trade in a tight range for days and weeks and then make a quick move in a few hours. Well, let’s wait for that move to come now, hoping that it will be on the downside since that’s what the charts are pointing at.


