Weekly Crypto Roundup
This week’s cryptocurrency market behavior was quite bullish, although not too volatile.
This week’s cryptocurrency market behavior was quite bullish, although not too volatile. Bitcoin sits at a very important key level and the upcoming months might decide whether $3000 was the final bottom or if there is more to come. So without further ado, let’s take a look at the latest news and the technical analysis of Bitcoin and Ethereum.
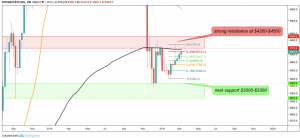
BTC/USD WEEKLY CHART

Bitcoin had 4 bullish weeks in a row and is trending up since December 14. Currently, BTC is very close to very strong resistance at around $4200. Additionally, the 200-week-EMA must be broken to re-test the resistance area between $4200-4500. Thus, Bitcoin needs a very strong increase in volume to gain enough bullish momentum to break the resistances.
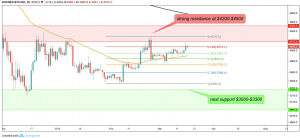
BTC/USD DAILY CHART

The 50-day-EMA acted as support so far. Bitcoin was rejected by the resistance so far, but as long as the 50-day-EMA holds we can assume another re-test of the resistance area. If $3736 fails to hold, Bitcoin finds its next support at around $3000.
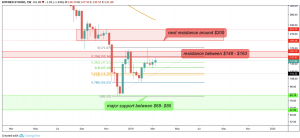
ETH/USD DAILY CHART

Ethereum had a false breakout a few days ago, which was quickly denied and followed by a steep decrease in price. It seems likely that Ethereum will re-test the resistance at $148-$163 again. However, if the golden pocket at $116 fails to hold, the next support will be found at around $80.
CBOE announced that it will stop offer any new Bitcoin futures contracts and Hedera Hashgraph, an alternative technology to the blockchain, granted nearly $700 million in hbars, Hedera’s cryptocurrency, to its employees, founders, etc.
- Check out our free forex signals
- Follow the top economic events on FX Leaders economic calendar
- Trade better, discover more Forex Trading Strategies
- Open a FREE Trading Account
