The Uptrend Remains in Place for USD/CAD As Long As This Moving Average Holds
USD/CAD has been trading in a bullish trend since August 2017. The uptrend hasn’t been too straightforward as we have seen some decent and irregular pullbacks during this time. But two and a half years is a long time and markets don’t go up on a straight line, so you’d expect some decent retraces and changes of heart despite the uptrend.
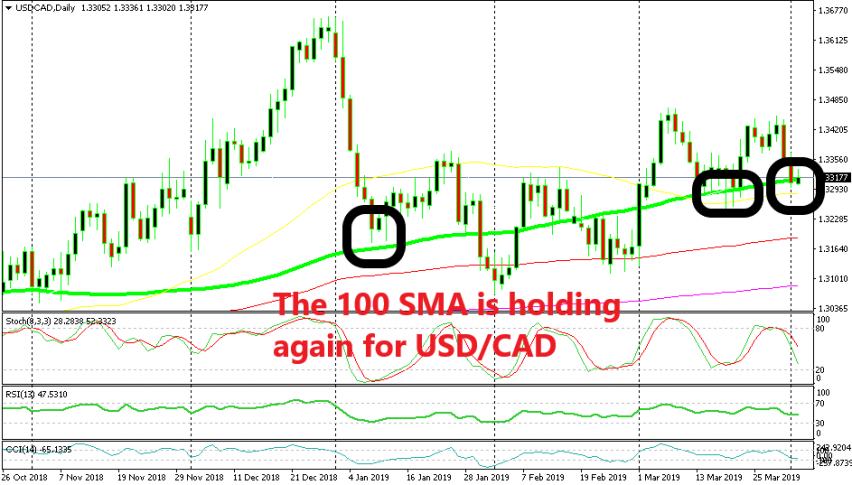
At the beginning of this year we saw one of those pullbacks lower as USD/CAD retraced around 500 pips lower in about a week. But, the 100 SMA (green) held it ground as you can see from the daily chart below. This moving average has been providing support and resistance before and it did so one more time back in January.
The sellers eventually broke below the 100 SMA at the end of January as Crude Oil prices made a bullish reversal, but the buyers pushed back up. At the middle of last month, we saw another pullback lower to test the 100 SMA which held again. The price reversed back up. Stochastic was oversold as well at that time, so the bullish reversal made sense.
Now, the price is back here at the same moving average after this pair has pulled back lower and declined 150 pips in the last two days as Crude Oil price keeps crawling higher. The price has already made a small bounce off the 100 SMA today. The stochastic indicator is not oversold yet but it s getting there.
So, there is a decent chance that USD/CAD turns bullish from here and resumes the uptrend. It’s not a very strong trade setup, but it’s an opportunity for buyers as the history on the daily chart has shown.


