The Long-Term Bearish Trend for Cryptos Might Be Over As Bitcoin is Starting to Bounce off the 50 Monthly SMA
In 2017, the cryptocurrency market was pretty mental as they kept surging higher the whole year. The performance of Bitcoin was quite stellar as it surged from around $700 to below $20,000, which means a 3000% increase. Some smaller cryptos did even better as they gained more than 10,000% of their value.
But, come 2018 and the situation changed completely. The trend shifted from massively bullish to massively bearish and cryptos lost 70-80% of their value. Bitcoin fell from the top and crashed all the way to $3,000 until December last year. All time-frame charts became oversold which meant that the downtrend was exhausted.
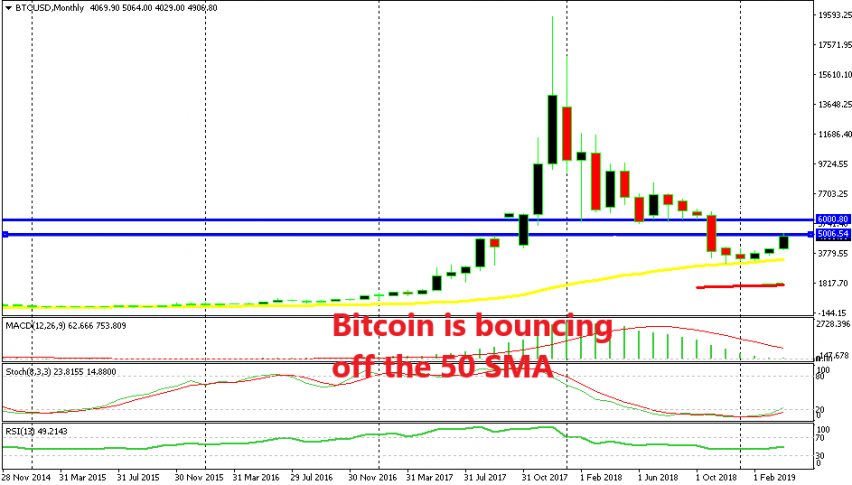
Besides that, the price reached the 50 SMA (yellow) on the monthly chart which has been providing support as far back as the chart shows. In fact, is seems that this moving average has already turned into support again for Bitcoin. It has been holding on for three months since December last year when Bitcoin bottomed out above the $3,000 level.
Yesterday we saw the price surge nearly $1,000 so the chart shows that Bitcoin is reversing at the 50 SMA and bouncing higher. Whether this will be a trend reversal remains to be seen, but the bounce is happening.
Although, Bitcoin did stall at $5,000 yesterday which is the first major resistance level on the way up. Above that comes the $6,000 resistance level, but first, let’s see if the buyers can push above $5,000. If not, then this is just a retrace higher before the downtrend resumes again. We are already short on Bitcoin since yesterday below the $5,000 resistance level hoping that we see a dip to the 50 SMA again before the trend reverses, if it does.


