The Long-Term Downtrend Slows in AUD/USD, Larger MAs Catch Up, but a Selling Opportunity Arises
AUD/USD has been on a bearish trend for more than a year since the USD reversed higher and this pair turned bearish. Since then it has seen only one way traffic to the downside, helped by a weakening global economy and, most importantly, by the trade war between the US and China, with commodity Dollars paying the price of that.
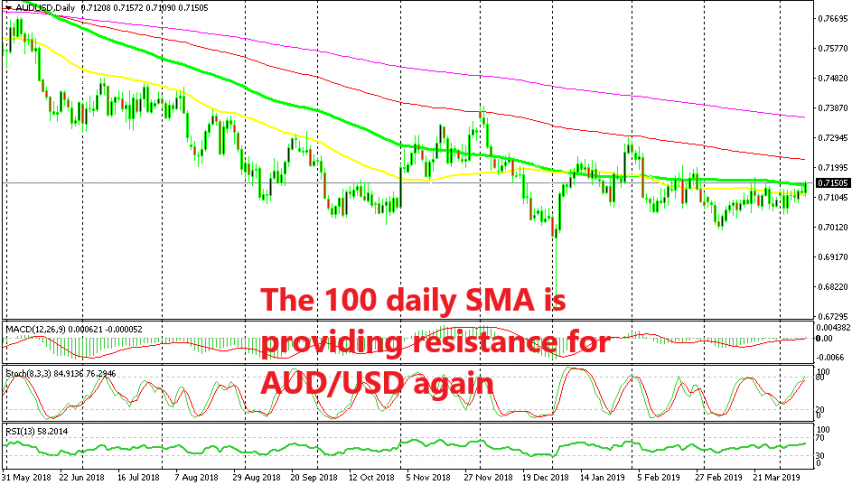
The downtrend was pretty strong last year, which can be seen on the daily chart above as the 50 SMA (yellow) provided resistance and pushed the price lower. But towards the end of last year the trend slowed down and the higher time-frame moving averages caught up with the price.
AUD/USD broke above the 50 SMA and the 100 simple MA (green) but found solid resistance at the 100 smooth MA (red) back at the beginning of December. It reversed down from there and resumed the bearish trend, making new lows at the beginning of January. In the last three months, the price action has been mostly sideways but the pressure has remained on the downside.
Although, the trend has slowed considerably; the 50 SMA has lost its appeal and now the price is flirting with the 100 SMA (green) on the daily chart. This moving average has been providing resistance during March, which implies that we might see another bearish reversal from here.
Commodity Dollars have climbed higher this month as the Chinese economy starts to improve, but we have only seen a couple of positive data releases from China, so it is a bit early to call on a reversal in the Chinese economy and on AUD/USD in the long term. So, this might be a good opportunity to sell this pair and hold until the Chinese economy makes a real shift into expansion.


