Gold Breaks the Range and Turns Bearish After Failing at the 100 SMA for the Third Time


GOLD has been bearish since the middle of February and earlier this month, it made an important break as it finally pushed below the support area at $1,280. The sellers also broke below the 100 SMA (red) on the daily chart which was yet another bearish signal, so the picture is all bearish on larger time-frames.
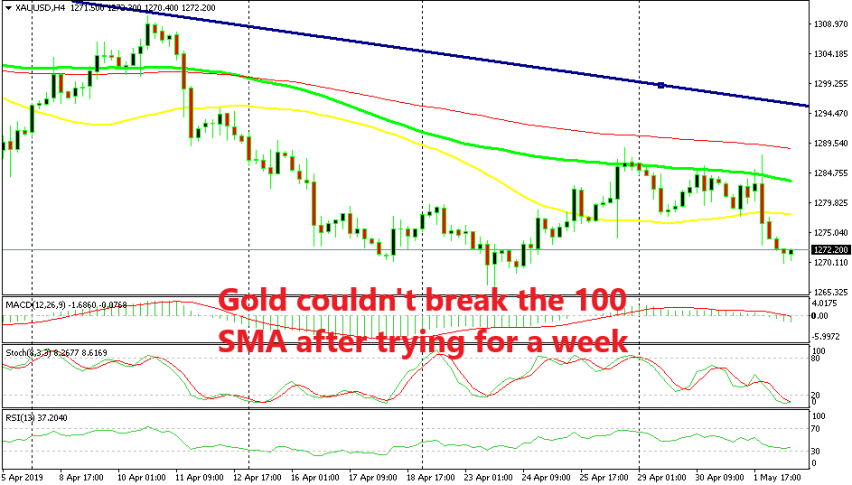
Although, we saw a retrace higher last week which accelerated after the US GDP report, which was impressive at first glance, but not so much on the details. As a result, Gold climbed to $1,289 but the buyers met the 100 SMA (green) up there which provided solid resistance that day.
The price formed an upside-down hammer which is a reversing signal and the reverse down didn’t take long to come. Gold reversed again as the week progressed above the 50 SMA (yellow) after forming a doji candlestick, this time to the upside. But, the 100 SMA held its ground again.
That price action repeated one last time yesterday as Gold bounced from the 50 SMA to the 100 SMA, but again the 100 SMA killed the plans from buyers, despite being pierced. Then the price reversed down again after Powell’s comments yesterday and this time, the 50 SMA was finally broken.
So, GOLD broke out of the range and now the picture looks bearish on smaller time-frames as well. Now the target for Gold is last week’s low at $166 and the 100 SMA on the daily chart is standing right above there, so that will be a tough level, but first, let’s see how we will get there.