Shorting EUR/USD at the 200 SMA
EUR/USD has been trying to turn bullish this week but it hasn't been able to hold on to gains above 1.12
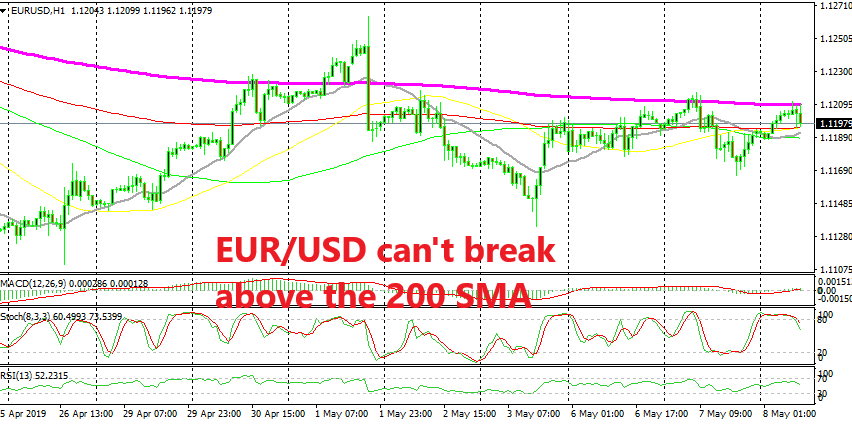
[[EUR/USD]] turned bullish last Friday after the round of economic data from the US which didn’t satisfy USD buyers. But, the main trend is bearish on larger time-frame charts, even though it has lost pace in recent weeks. So, the safest way to trade this pair is still playing the downside.
That’s even more so now after this pair has been having difficulties staying above the 1.12 level this week. Buyers have pushed above it a few times but they can’t hold on t gains above that level. That shows that the pressure is still on the downside, but it’s only that traders are waiting for the situation regarding US-China trade war to clear up, which might find a solution over this weekend, I hope.
Besides that, the 200 SMA (purple) is lying at 1.1210 on the hourly chart and it has been providing resistance in the last two days. It has also provided resistance before so it is a strong indicator on this time-frame. The stochastic indicator is also overbought here and on the H4 chart, we have the 100 SMA (green) providing resistance, so it looks like a reversal is about to take place to the downside, hence our sell signal.
- Check out our free forex signals
- Follow the top economic events on FX Leaders economic calendar
- Trade better, discover more Forex Trading Strategies
- Open a FREE Trading Account
- Read our latest reviews on: Avatrade, Exness, HFM and XM
Related Articles


Sidebar rates
Related Posts
