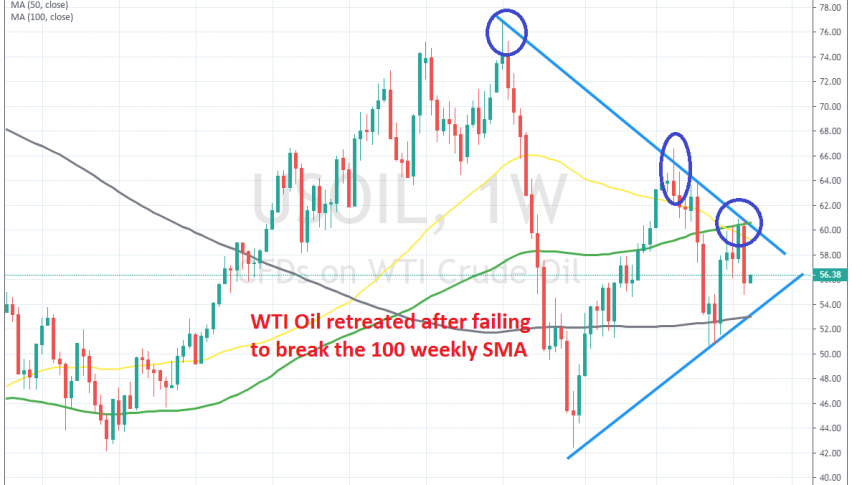
WTI Crude Oil Fails at the 100 SMA and Makes the 3rd Lower High


Looking at long term charts of Crude Oil such as the weekly time-frame, we can see that the main trend for WTI crude is bearish. This trend started at the beginning of October last year and US crude fell around $35. The trend reversed at the end of December after OPEC+ decided to put in place production quotas. The economic rebound across the globe in Q1 also helped improve the sentiment.
The climb continued during most of April but it stopped at $66.50, which is lower than the previous high at $77. The global economy weakened considerably in Q2 and the trade war escalated again in Q2 which hurt the sentiment. WTI turned bearish again and fell to $50.
Although, it reversed again off that big round level after OPEC+ announced an extension to the production quotas. Again, geopolitical tensions between Iran and US/UK helped Crude Oil, but it seems like that is not enough. WTI crude moved to $61 but failed to break the 100 SMA (green) on the weekly chart and the descending trend line helped provide resistance too, and last week US Oil fell around $6.
That makes three lower highs which point to further declines. So, I expect Oil to remain bearish at least until the 20 SMA (grey) at $52, which is where the ascending trend line comes. Pullbacks higher on shorter time-frames should be seen as good opportunities to sell.