

It has been a big week for the USD/CAD, with rates putting in a hard test of the 1.3200 handle. All in all, this pair has rallied more than 125 pips on its way to fresh monthly highs. Going into next week’s FOMC meeting, the pressure will be on the Greenback as the first interest rate cuts since 2008 are slated to go into effect.
In addition to the FED, the WTI market will be front-and-center in the action facing the Loonie. As discussed in an earlier update, WTI is in a heavy seven-session consolidation pattern near $56.00. If we see a definitive break in crude oil, the USD/CAD will respond accordingly.
Let’s dig into the technicals facing the Loonie and break down two key Fibonacci macro resistance levels.
USD/CAD: Fibonacci Resistance In View
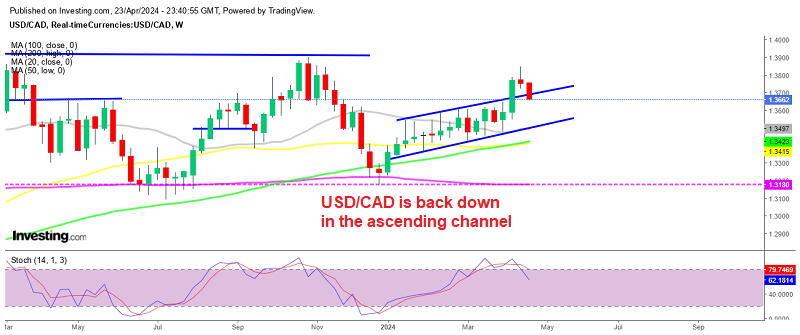
Since the bearish plunge of late-June, the USD/CAD has traded mostly in a sideways fashion; that is, until this week. With rates firmly on the bull, this pair is now in the process of testing the June 18 to July 19 downtrend.
+2019_07_26.png)
Here are the two key Fibonacci resistance levels to watch throughout next week’s trade:
- Resistance(1): Macro Wave 38% Retracement, 1.3175
- Resistance(2): Macro Wave 62% Retracement, 1.3273
Bottom Line: At press time, the 38% Macro Wave Retracement (1.3175) is being challenged. If it gives way, look for 1.3273 to come into play for the USD/CAD at some point next week.
Until elected, I will have sell orders in queue from beneath the 62% Macro Wave Retracement from 1.3269. With an initial stop at 1.3309, this trade produces 40 pips on a static 1:1 risk vs reward ratio.