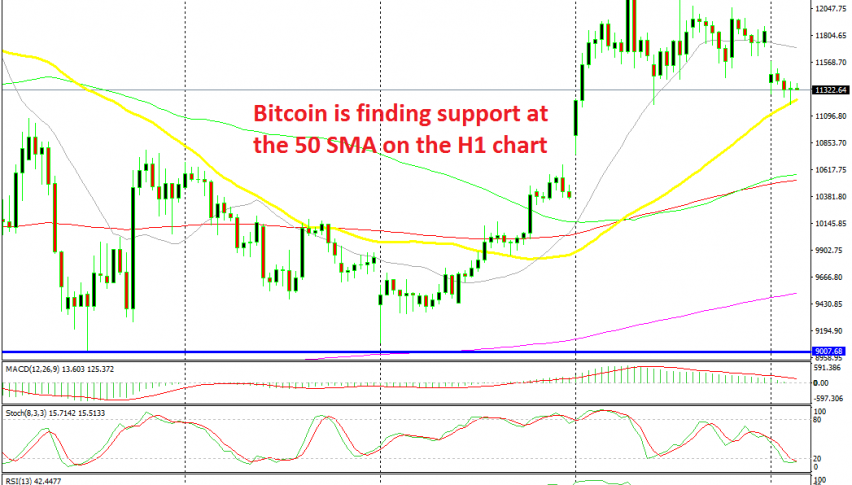
Bitcoin forms a Bullish Reversing Signal at the 50 SMA


Cryptocurrencies turned quite bullish in Q2 of this year. They had a terrible year in 2018, with BITCOIN declining from below $20 at the end of 2017, to $3,000 in the last few days of 2018. In Q1, cryptos consolidated in a tight range as Bitcoin traded between $3,000 and $4,000.
But the situation changed once the $4,000 level was broken and the buyers became increasingly confident as the price was moving up. They broke all major resistance levels and the price reached close to $14,000 at the end of June. But in the last two months, buyers haven’t been able to make new highs.
During these last two months Bitcoin has consolidated inside a range, forming a bottom at $9,000 and a top at $14,000. The buyers returned at the end of July and they pushed higher but they couldn’t make new highs last week and today the price is retracing back down.
But, the 50 SMA (yellow) is holding on right now and it seems like a bullish reversing pattern is forming here. The stochastic indicator is oversold, which means that the pullback is complete and the previous H4 candlestick closed as a doji, which is a reversing signal. This looks like a good chart setup to go long, so here you have a trade if your funds allow a trade in Bitcoin.