Moving Averages Continue to Keep Gold Bullish
GOLD has been bullish for a year now, since it turned higher at around this time last year. During this time we have only seen a decent pullback on larger time-frame charts during Q2 of this year and since then, the trend has picked up even more speed, as the global economy weakens and trade tensions increase.
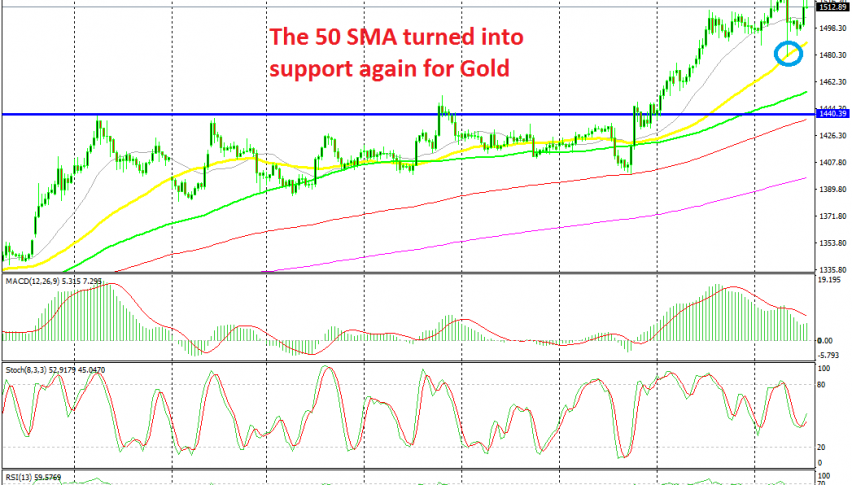
Safe havens benefit greatly in such periods, hence the decline in USD/JPY to 105. Buyers pushed above the $1,440 level this month which is a long term resistance level and yesterday Gold reached as high as $1,535 on my platform yesterday.
During this bullish trend, moving averages have helped keep the uptrend going for Gold as they keep providing support on pullbacks lower. The 50 SMA (yellow) and the 100 simple MA (green) have been pushing the trend higher on the H4 chart, but two weeks ago the 100 smooth MA (red) also provided support.
The 20 SMA (grey) was providing support early this week, but it was broken yesterday during the reversal, although the 50 SMA came into play again and Gold bounced back up from there. So, moving averages seem like good indicators to look for entry points on Gold on the bullish side. If Gold retraces to the 50 SMA or the 100 SMA again, then we will look to buy.


